Next Post
Working with Object Altitudes in Carmenta Engine
Explore various methods to handle object altitudes in Carmenta Engine, including GlobeView.GroundAt, ElevationOperator, and OffsetOperator, with best-use scenarios.
View PostIn this article, you will be introduced to the VerticalProfileOperator, that provides a cross-section view of the topology and application data along a given route. A vertical profile provides additional insights on how the terrain shifts along the route and how and where objects affect the route.
We will start with the bare minimum configuration to visualize the terrain along the route. Then we will improve by adding new contents such as the route and, obstacles.
The configuration from this article is available, here (Note that you need a Carmenta Engine SDK environment to open it).
To set up a vertical profile we need to configure our View to accommodate this type of presentation as well as configure one or more VerticalProfileOperator instances to generate the content of this view.
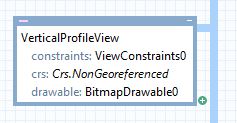
The purpose of the View is to render the scene based on the different inputs. The presentation will be an image that from left to right extends along the input route and from bottom to top extends vertically. Since this view doesn’t match a geographical or projected coordinate reference system we will configure our View with Crs.nonGeoreferenced. This Crs defines reference system with to orthogonal axes with values defined in meters.
Note: It is not possible to use the projectTo methods on this Crs type to project coordinates into another Crs.
This operator will generate a vertical profile through the data from ElevationInput, along a given route from RouteInput. Below, the full chain we will use at the start, you can get it from the sample provided in the article:

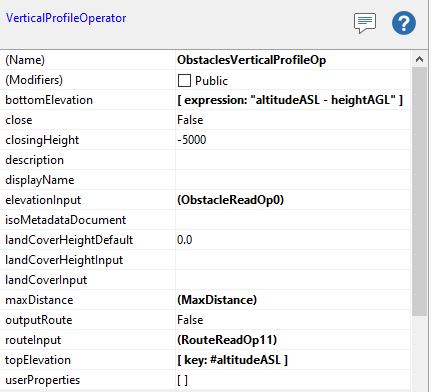
In detail, our VerticalProfileOperator will be configured like that:
Then we have our VisualizationOperator to apply a visualization on our output. So far, we are only interested in displaying polygons features. Lastly, the VisualizationOperator is connected to a layer (TerrainBufferZone). By connecting the TerrainBufferZone layer to the previous View, we produce the following result representing the elevation along our route:
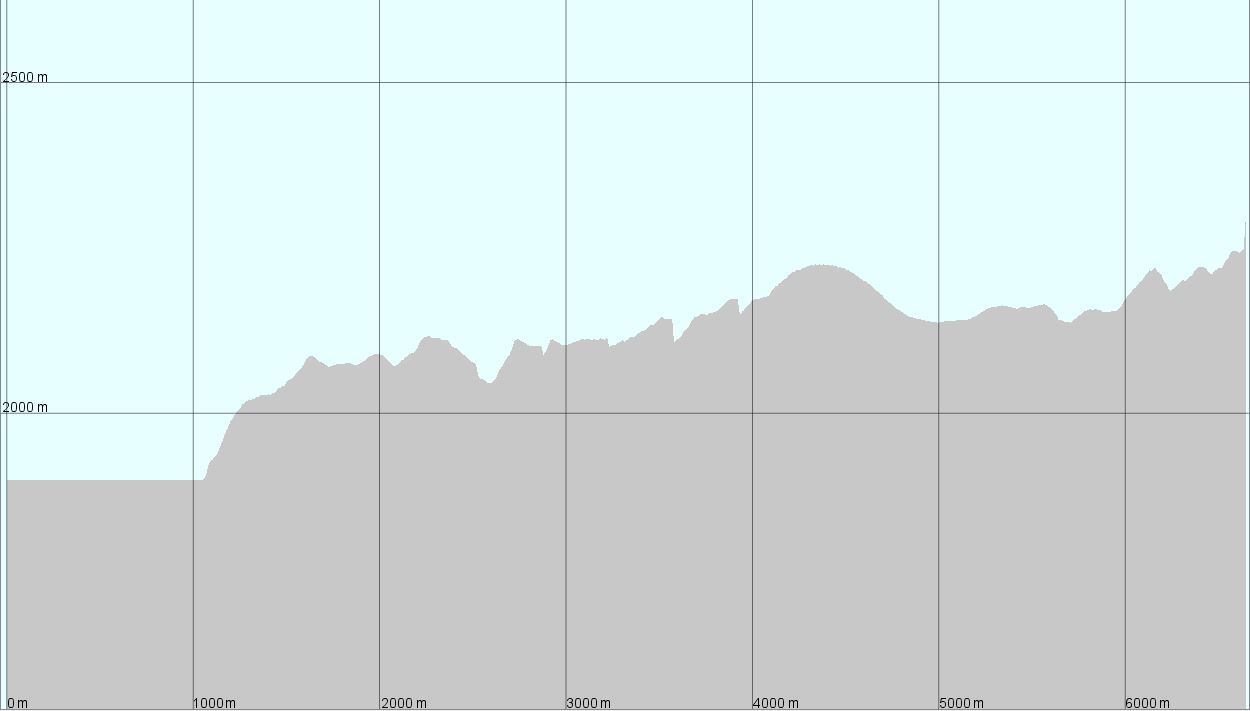
As we see, we have the bare minimum: the elevation along our route (the route itself is not visible yet). The background cyan color is configured on the Drawable of the View.
The grid comes from another layer, feel free to reuse it from the configuration:

Now, we will implement different improvements to the scene. The goal is to provide the user with more information in the vertical profile.
Most improvements will add an extra Layer and VerticalProfileOperator, this is a better design than using a single Layer and VerticalProfileOperator for all inputs. Configuring one VerticalProfileOperator per data type gives us a more structured configuration where the properties of different data types are controlled independently.
Previously, we displayed the terrain along our route (with the close property set to true), but we don’t really know if our route is crossing the terrain or keeping a safe distance. We will now add the route to the scene in another Layer and VerticalProfileOperator:

With the VerticalProfileOperator configured:
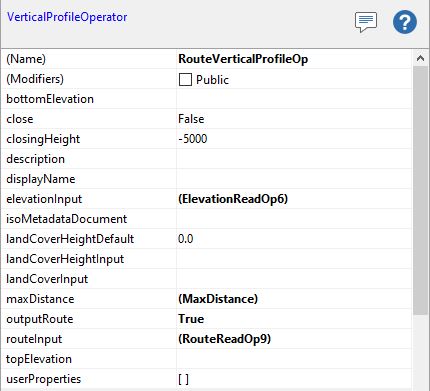
In order to display the route, on the VerticalProfileOperator we turn the property outputRoute to true. This is especially useful for flight routes since the altitude (Z value) is meaningful. When dealing with ground routes the Z will most likely be 0 or the same height as the terrain.
To visualize the result, we use a VisualizationOperator with a LineVisualizer. To configure the visualizer to specifically present the route, and no other features, we add the condition “vpopSourceGeoType = #routeLine” on the LineVisualizer. We also add a TextVisualizer with the same condition as the previous LineVisualizer to display a fixed label “flight route”, but in a more realistic scenario that text or identifier would be coming from a feature attribute (or removed if no text required). This layer gives the following scene:
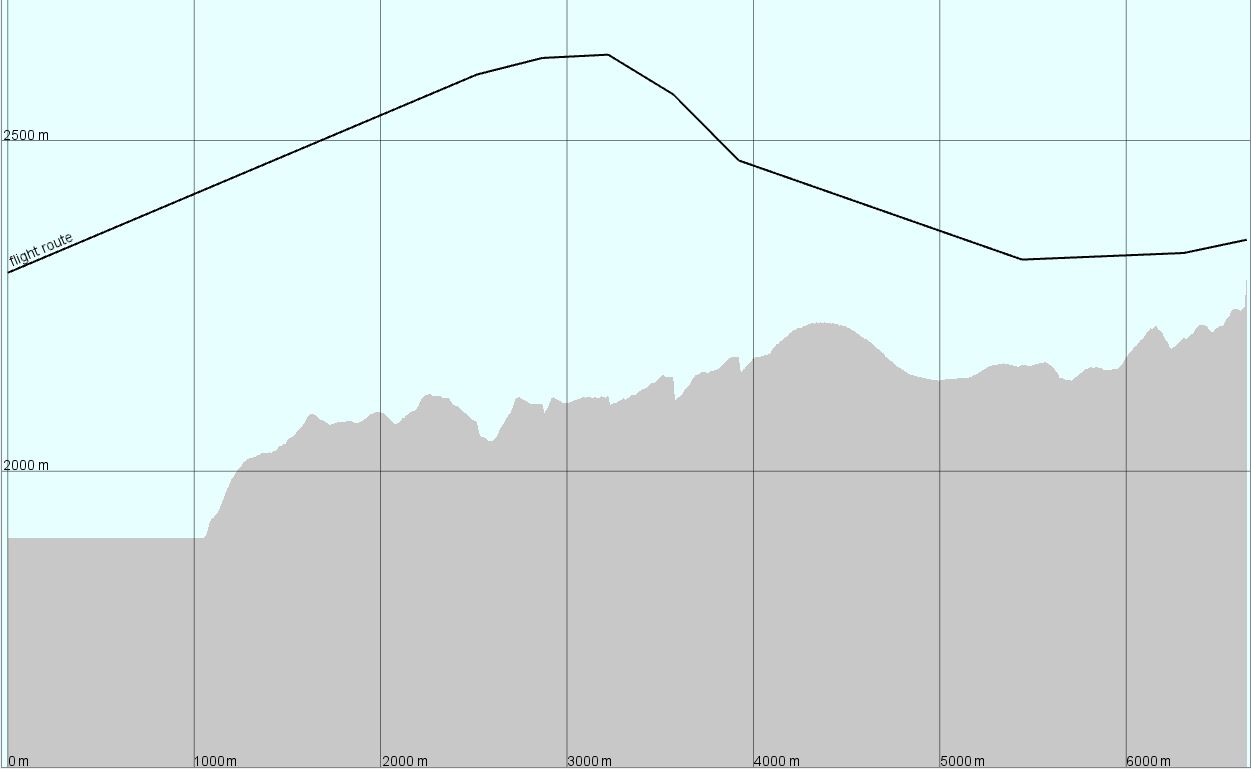
Our simple example uses a line with fixed elevation. For an airborne use-case you will likely have a route line with varying elevation. The route elevation (Z values) might be part of your application data but can also be generated in runtime using an operator such as the AirRouteOperator. Either way the vertical profile will give you a visual confirmation that the route is at safe distance above the terrain.
Now, let us improve the terrain layer. From before, we know our route is above the terrain, but is it above treetops and buildings?
We can find out by adding information on land cover and land cover heights using landCoverInput and landCoverHeightInput and visualize them in the scene.
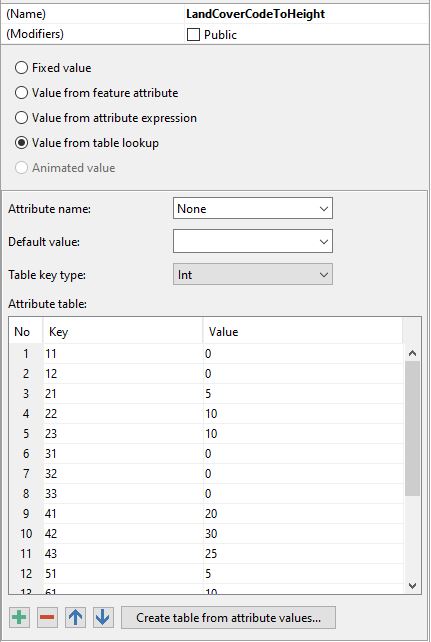
The resulting layer chain look like this:

Since the land cover data source we are using has a color palette defined, with one color specified for every land cover type, we can now remove the explicitly defined VisualizationOperator for the terrain layer. The features of this layer will be assigned automatically generated visualizers based on a color palette available in the data source.
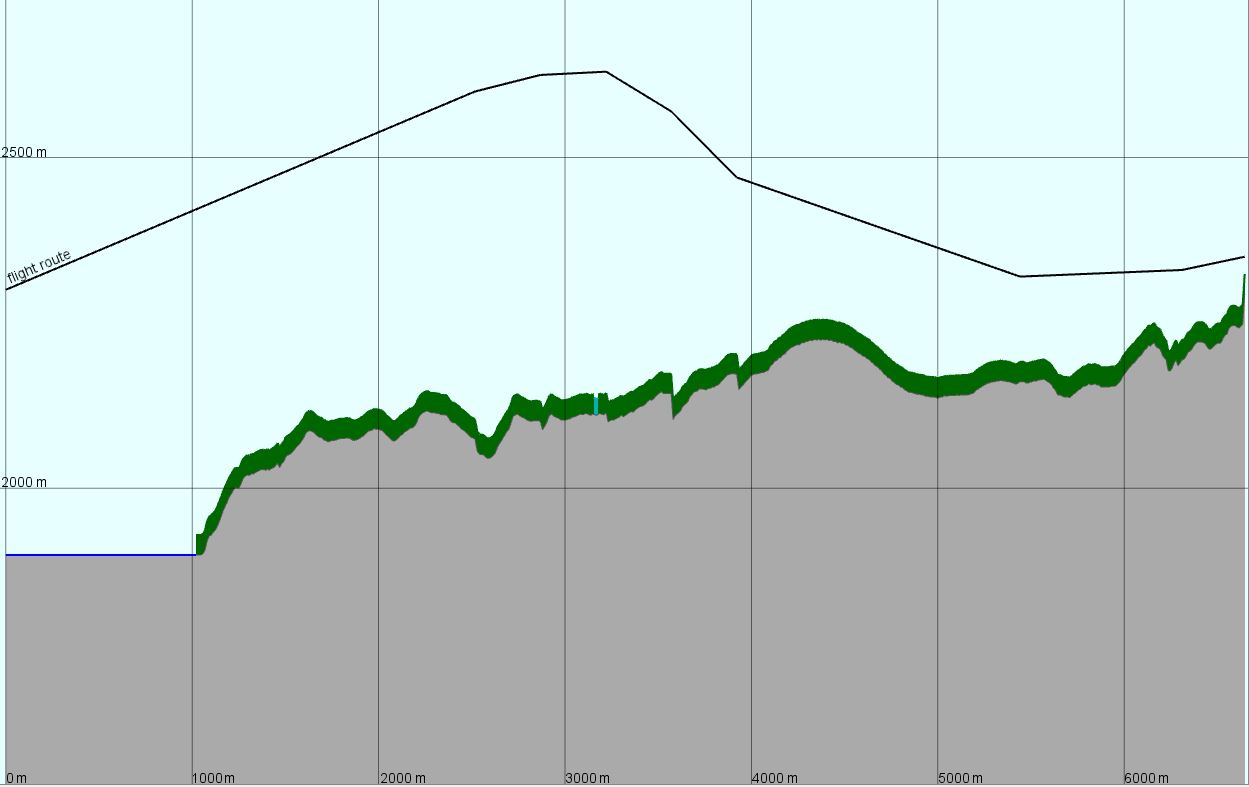
From terrain and lands covers, the route appears operable. We will now explore representing other type of features, like obstacles. An obstacle is represented as a point feature on the vertical profile. In our example they are obstacles, but there could also be points of interest or other point features you want represented in the profile.

As mentioned in the beginning of the article, elevationInput support multiple types: raster, points, lines and polygons. Using the ObstacleDataSet as input for the elevationInput will allow us to see where along the route the obstacles are located. The VisualizationOperator defines the how the obstacle should be presented in the vertical profile.

Each obstacle (point) feature in our configuration has been assigned an attribute specifying its altitude above sea level (altitudeASL), as well as an attribute for height above ground level (heightAGL). We’ll use these attributes to configure the VerticalProfileOperator. The topElevation property is set to use the altitudeASL attribute and for the bottomElevation we’ll use an expression “altitudeASL – heightAGL“. These properties controls how the obstacles are presented in the vertical profile, that is the vertical extension of the objects.
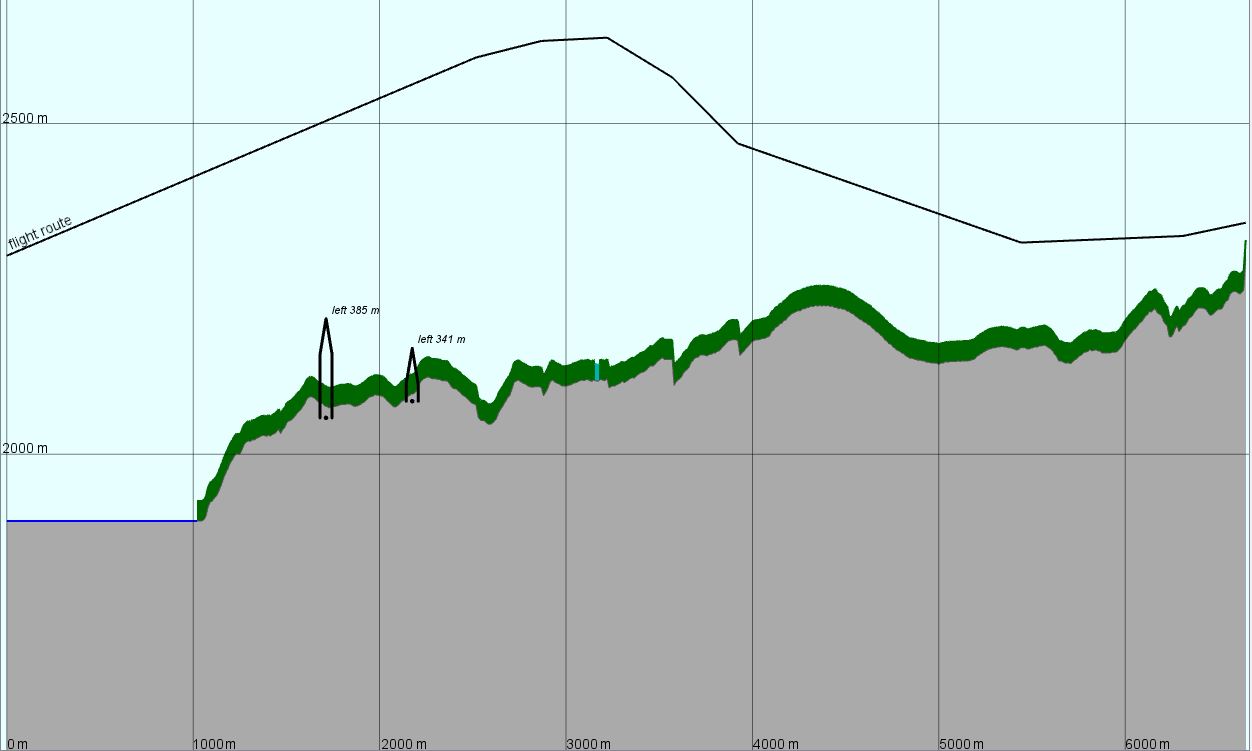
The text label is specified using the vpopDistanceToRoute attribute. This attribute is calculated by the VerticalProfileOperator and assigned to the output feature. In our case, since our obstacles are points features the meaning of vpopDistanceToRoute attribute is the horizontal distance to the fence. The value is a signed number, with positive numbers meaning left of the route (as walking along the route starting from its first node).
The previous section detailed an example using point features as input to the elevationInput. Next we will use airspace polygons as input to elevationInput.

Like before we will define the topElevation and bottomElevation properties on the VerticalProfileOperator using the upperLimit and lowerLimit attributes from the features:
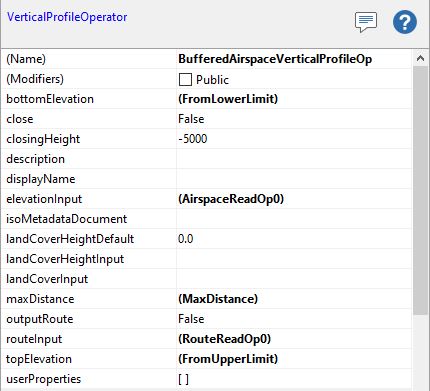
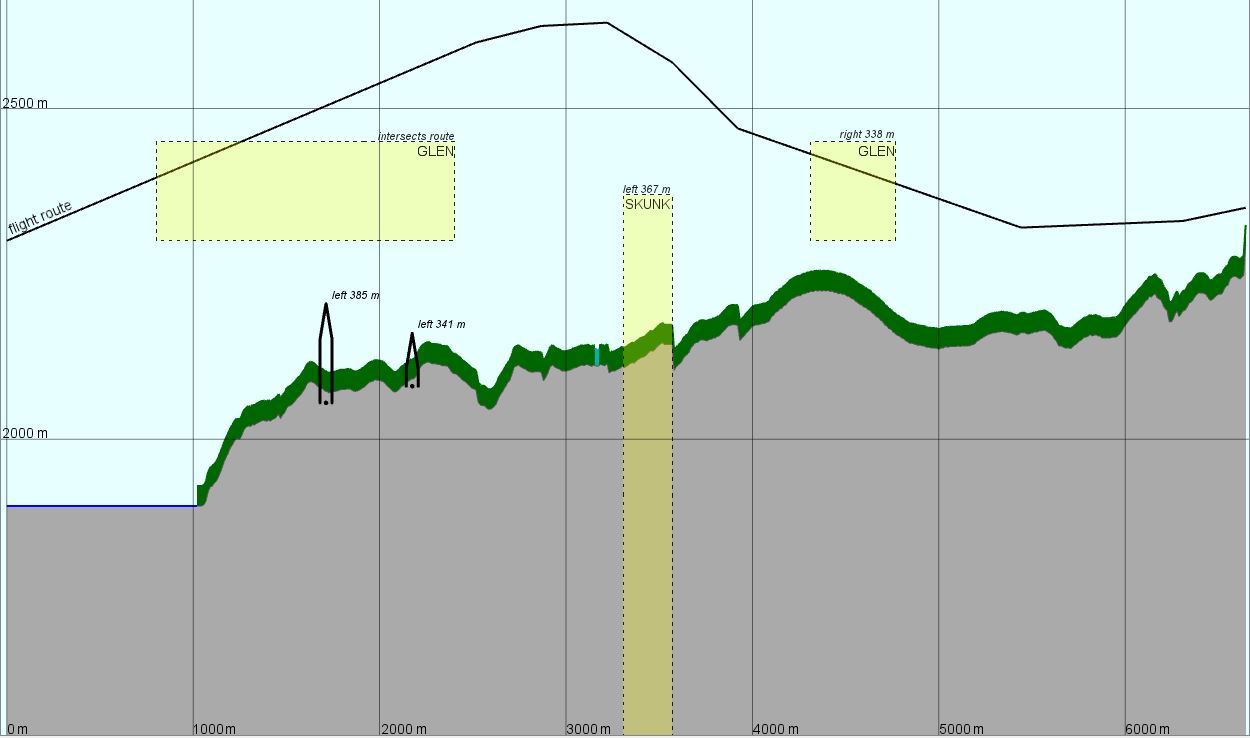
Again the VerticalProfileOperator will add attributes to the output features. In the case of lines and polygons features: it can have some parts that are close enough to the route to generate output, while other parts are too far away (farther than MaxDistance). This means that a single line or polygon can generate several output features. Each of these will have their own value for vpopDistanceToRoute, expressing the minimal horizontal distance from that feature to the route. The value is signed, and a positive number means left of the route.
Adding the layer to the view, we get the following result:
If you open the configuration file in the archive found in the beginning of this article you will find two views; Plain2DView and VerticalProfileView.
The Plain2DView defines a standard (non-vertical) 2D map view with a topographical map background overlayed with an application scenario. The features of the application scenario, such as airspaces and route, can be edited in this map presentation.
Our vertical profile is defined by the VerticalProfileView. This view shares most of data source used by Plain2DView, with the difference that the data is processed using the VerticalProfileOperator functionality.
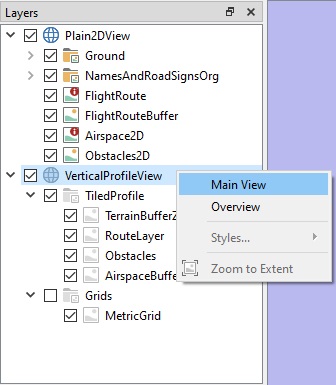
You can switch between the views by right clicking on the View item in the Layers panel and, in the context menu, set the View to be displayed as ‘Main View’:
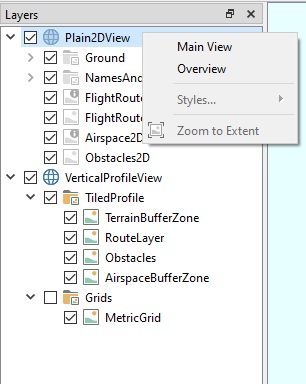
Once switched, the VerticalProfileView will be disabled (in the Layers list it will be grey) and the Plain2DView will be presented:
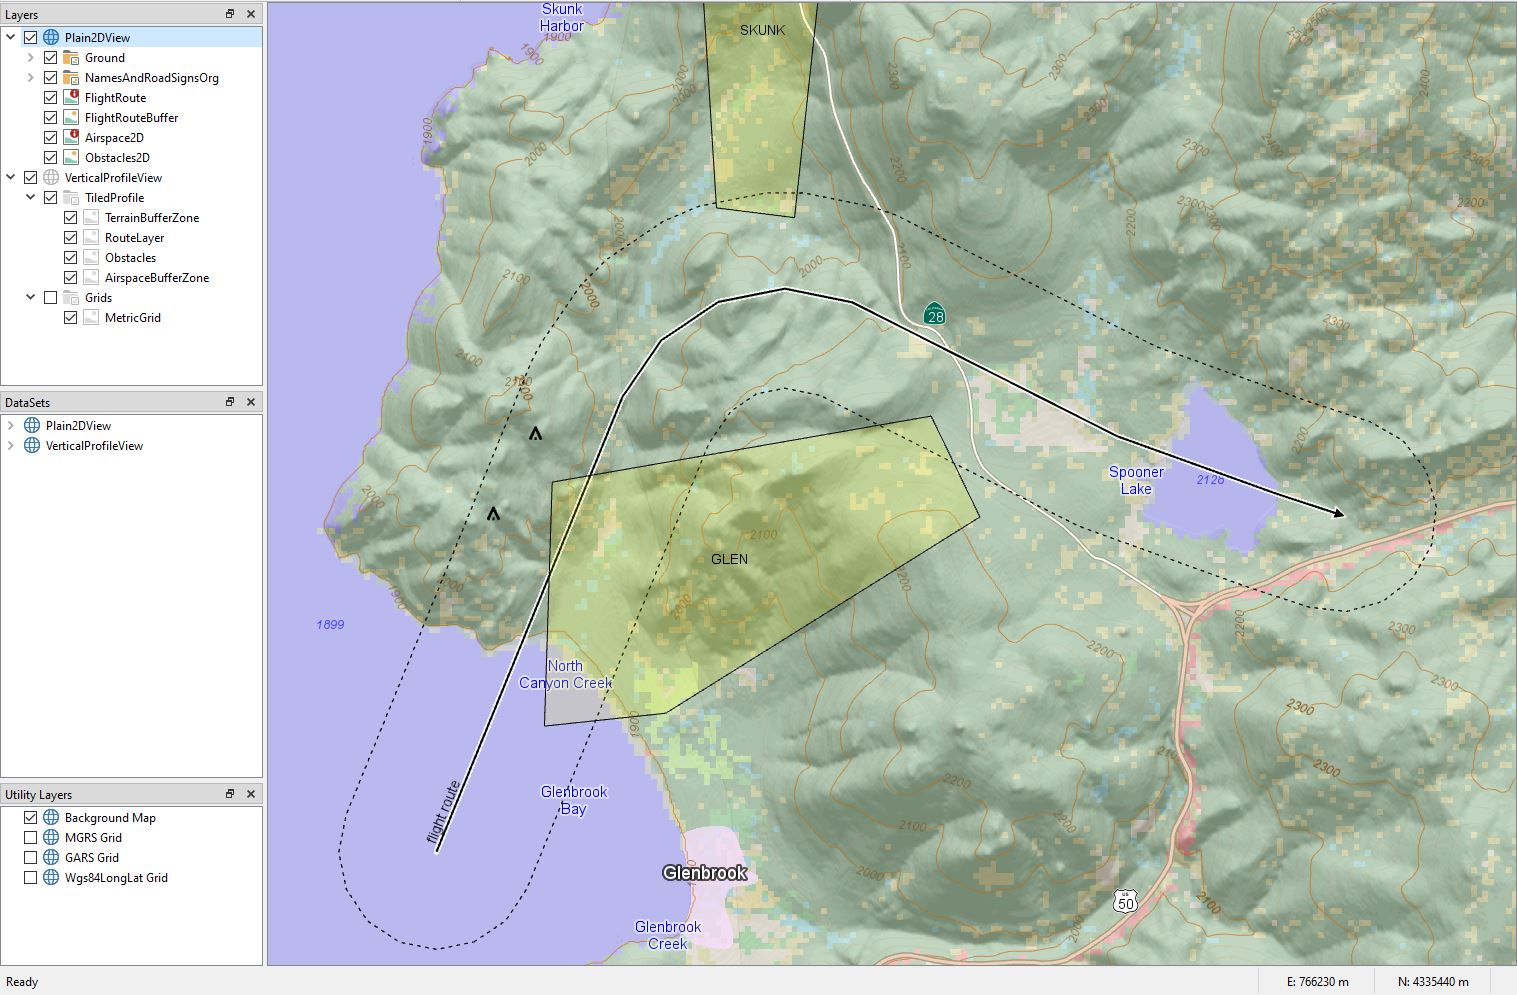
Here we can edit the application layer (e.g. edit the path of the route nodes and change the extent of the airspaces). You can then switch back to the VerticalProfileView and see that the scenario has been updated to reflect your modifications:
Working with this map configuration, we see how the vertical profile functionality can be applied to provide a new perspective to strengthen situational awareness. Both views display the same application scenario, but the different perspectives add to a richer understanding.
As a next step you are encouraged to look into the Vertical Profile Sample. The sample project, using C++ and Qt, defines an application with two views displaying a map and a vertical profile respectively. Showcasing the power of putting situational awareness front and center.

Explore various methods to handle object altitudes in Carmenta Engine, including GlobeView.GroundAt, ElevationOperator, and OffsetOperator, with best-use scenarios.
View Post
In the last part, in our series of articles on Carmenta Engine in .NET, WPF, we go through how to connect multiple instances of our client to the service set up in the previous article.
View Post