Visibility Analysis
In Air Defense and Counter-UAS, having a well-protected airspace involves employing a combination of detection, identification, tracking, and interception capabilities to neutralize any potential threats to the airspace’s security and integrity. This includes real-time airspace coverage analysis by combining several live data sources.
As understanding airspace coverage can be very complex, visualizing the coverage of an airspace in an easy-to-understand way becomes crucial. Carmenta technology has a range of features designed to provide comprehensive visualization solutions tailored to this exact need.
Carmenta’s Real-time line-of-sight analyses provide awareness of how much protection a sensor provides to your airspace. Quickly analyzing which effector is best suited for a target provides you with valuable time in a critical situation.
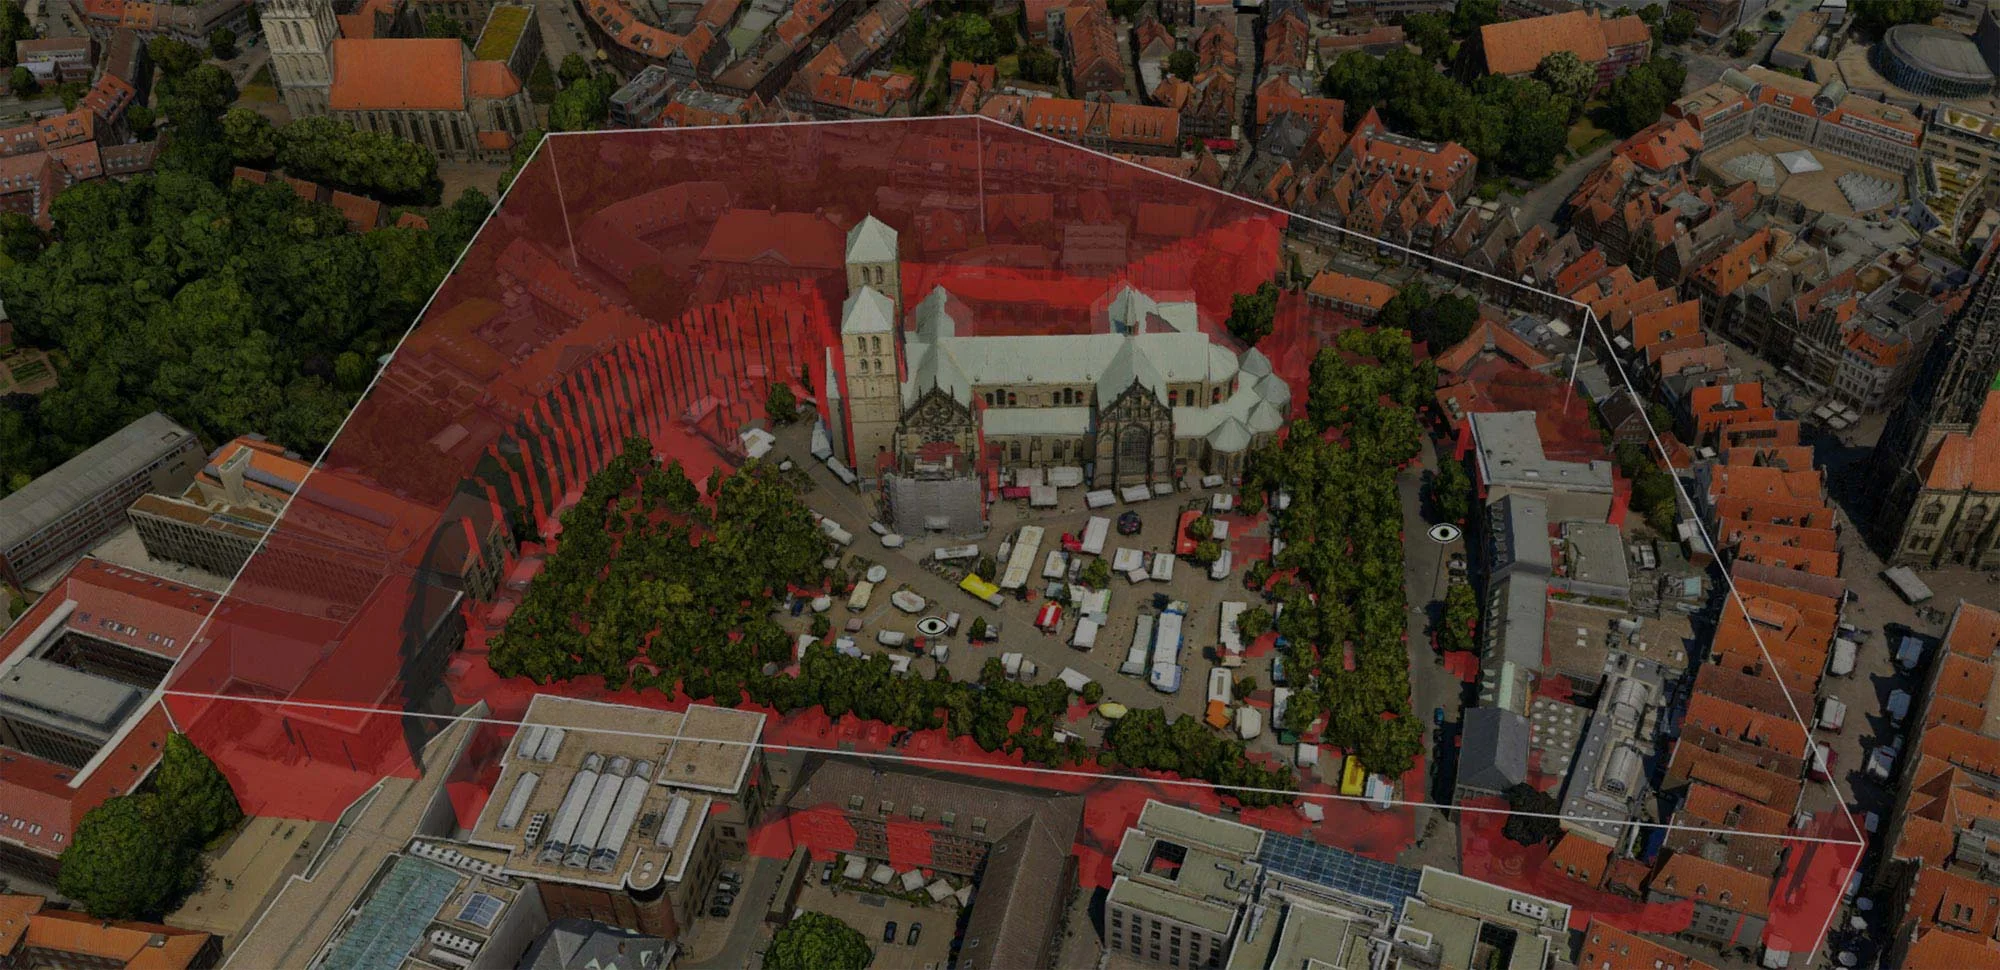
Real-time line-of-sight analysis, for both ground-based and airborne observers, provides operators with a clear understanding of sensor or effector coverage. By visualizing which parts of the surrounding terrain an observer can see, and taking sensor characteristics into account, the analysis can be performed in both 2D and 3D. This helps operators identify and analyze blind spots, and strategically position sensors for optimal coverage.
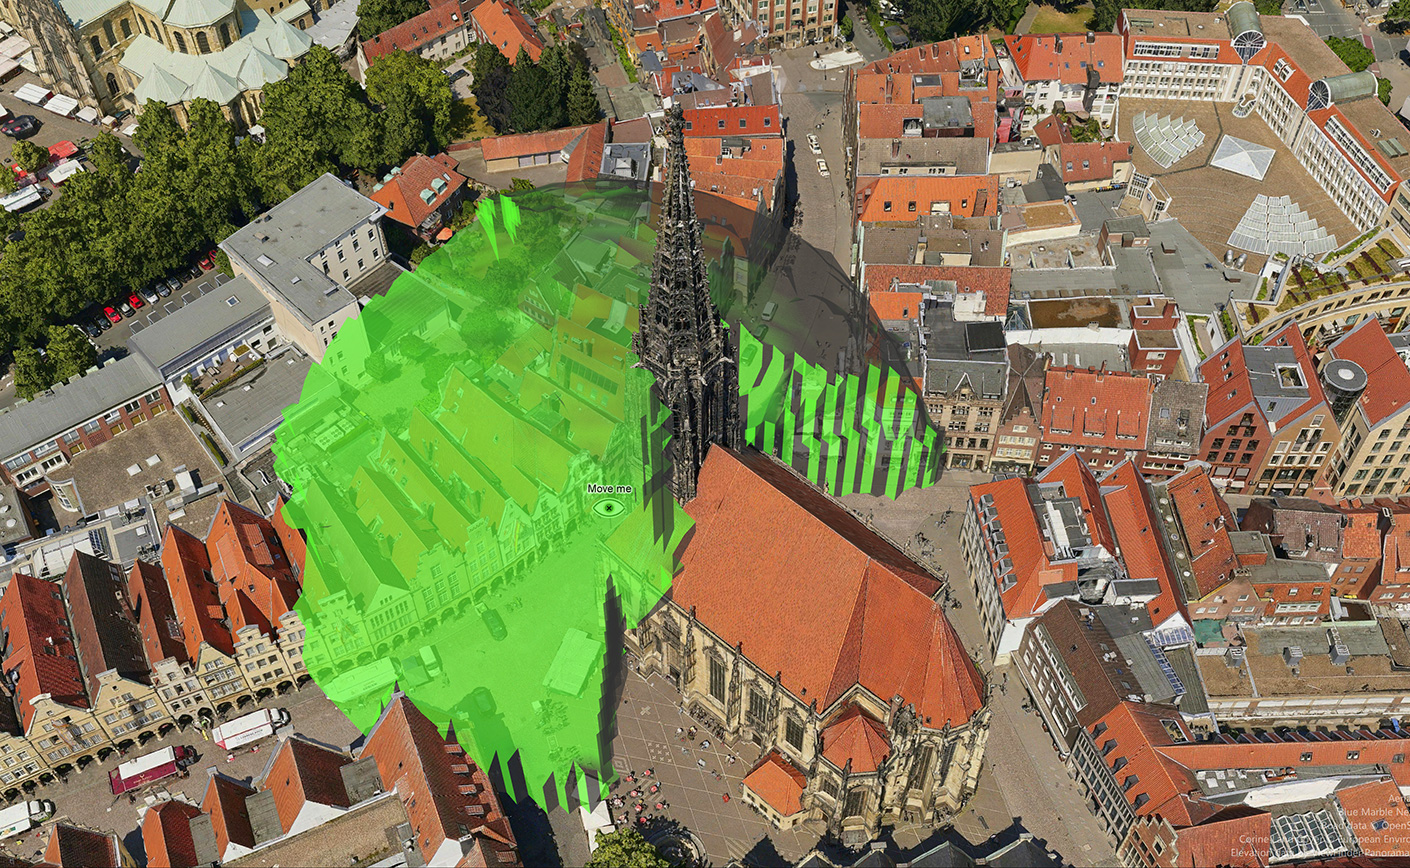
The green volume shows the coverage of the sensor in the city environment. (3D city model from IGI).
Carmenta offers real-time target line-of-sight calculations to establish direct visibility between observers and targets, taking terrain and potential obstructions into account. This makes it possible to track multiple targets, either manually or automatically, and determine the most appropriate sensor or effector to engage. Operators can choose the effector themselves or let the system automatically select the most suitable option.
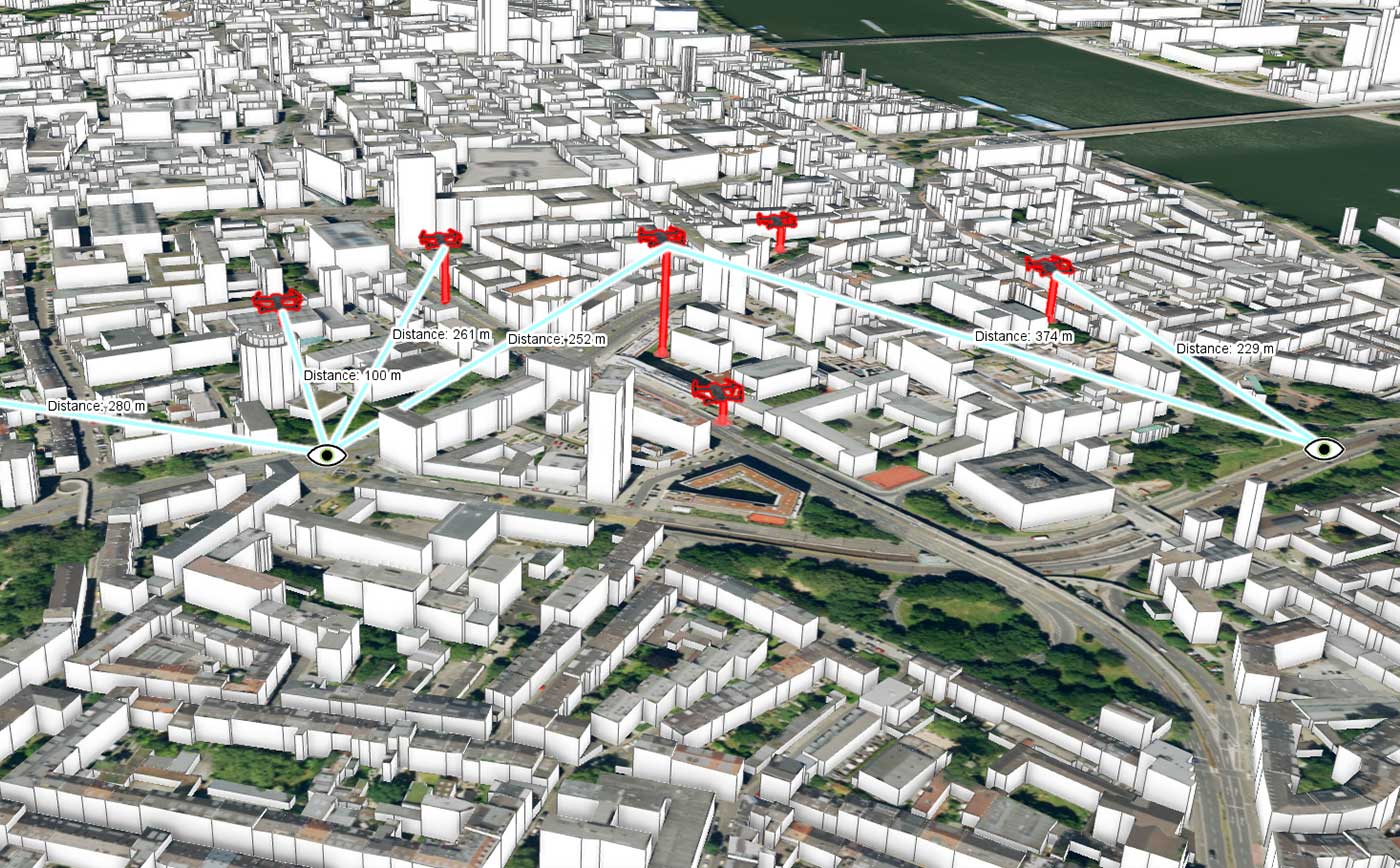
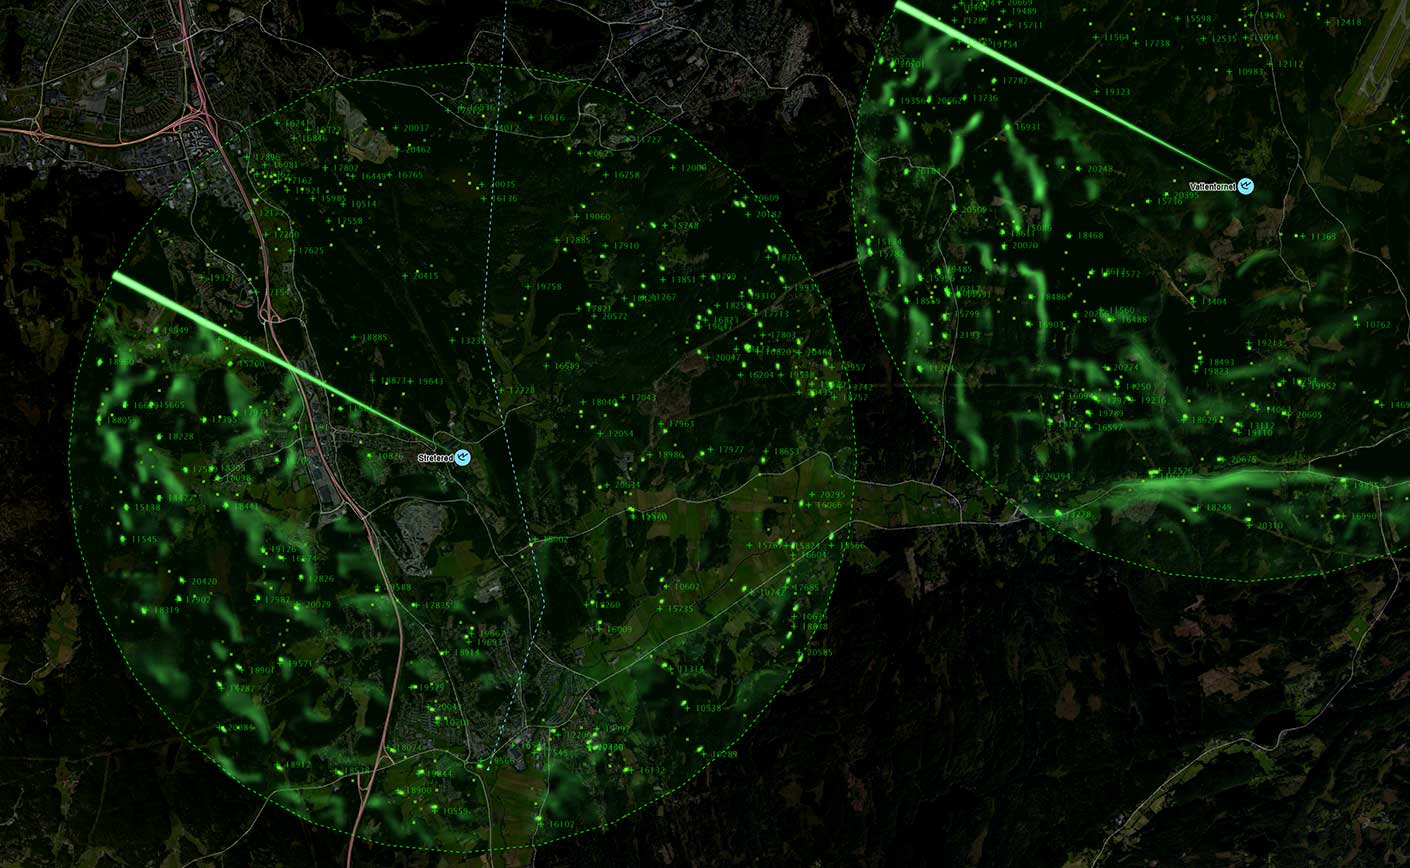
Target line-of-sight. Each line is the direct line-of-sight from an observer to a target, in this case drones.
To protect your airspace, it is vital to enable operators to easily understand and optimize sensor positioning and detection rates. Carmenta’s airspace coverage analysis is based on sensor position and characteristics, allowing operators to specify specific sensor setups and see the effect of these changes in real-time, helping them continuously optimize detection performance.
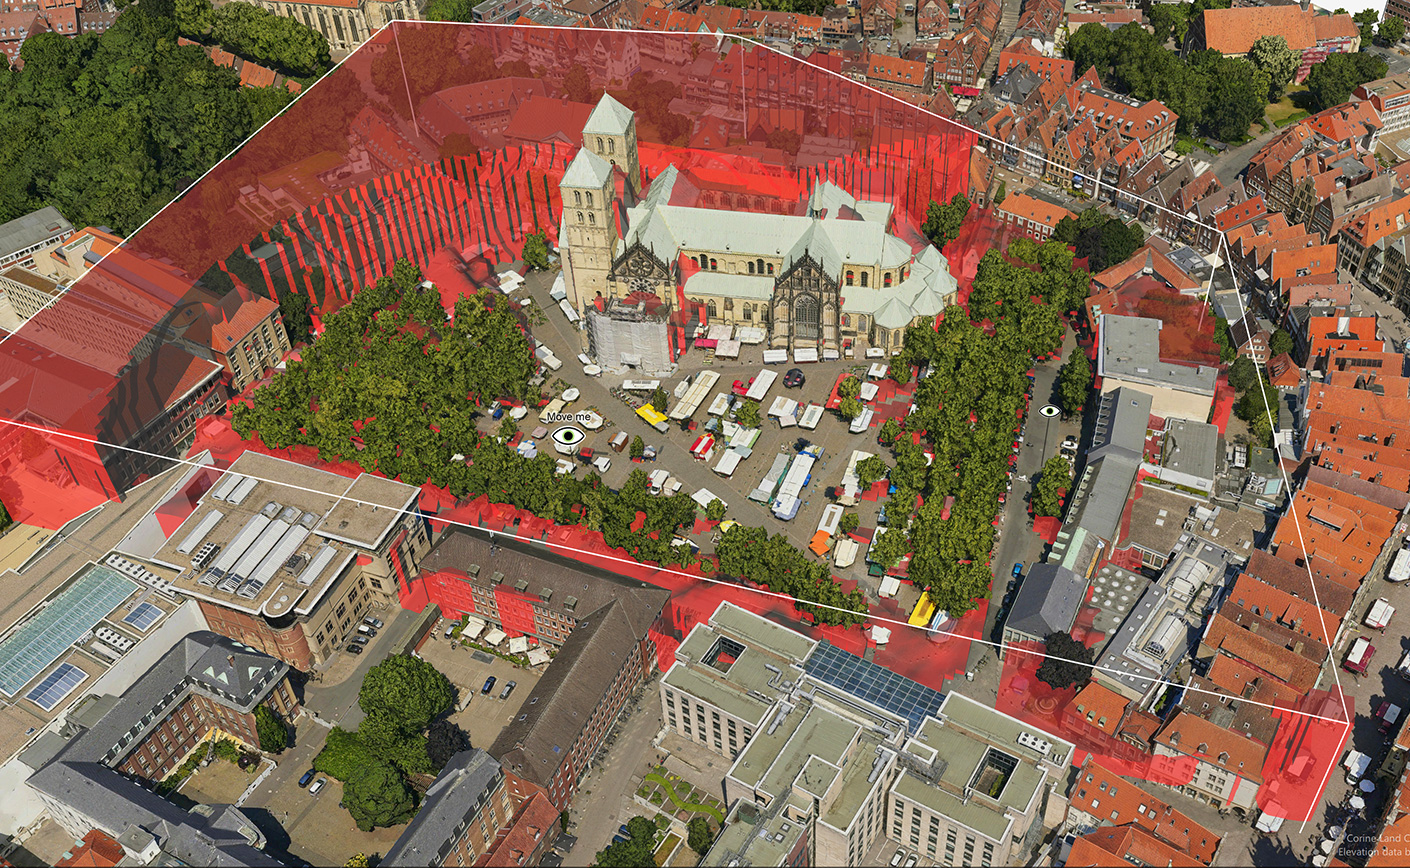
By moving the sensor, coverage of the surrounding airspace is updated in real-time. (3D city model from IGI).
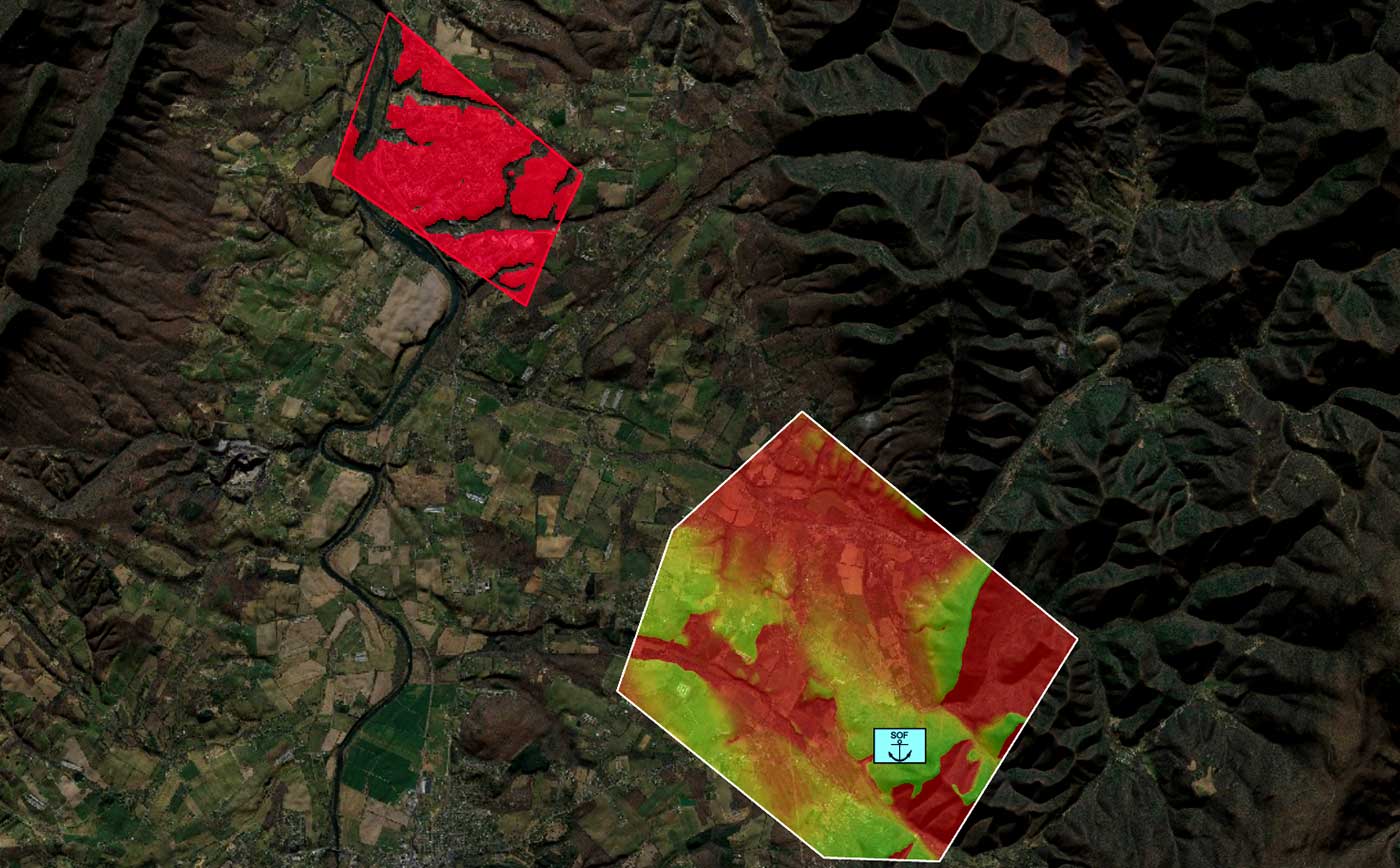
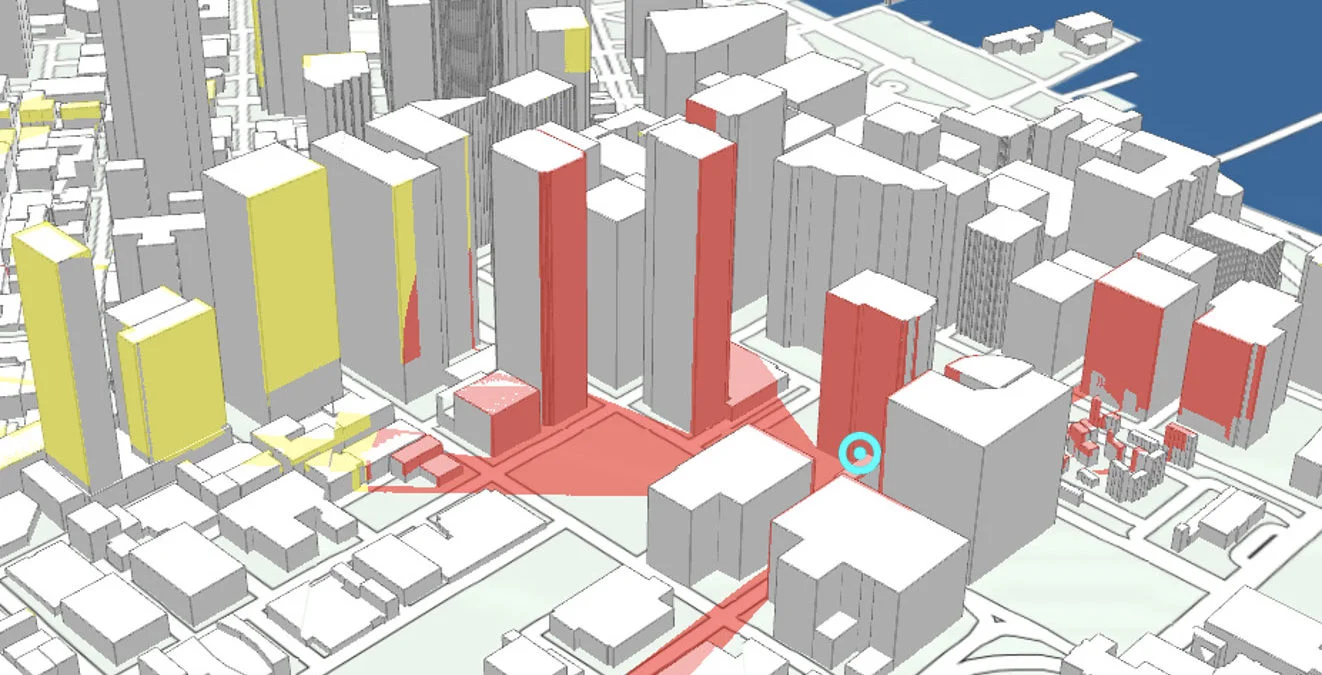
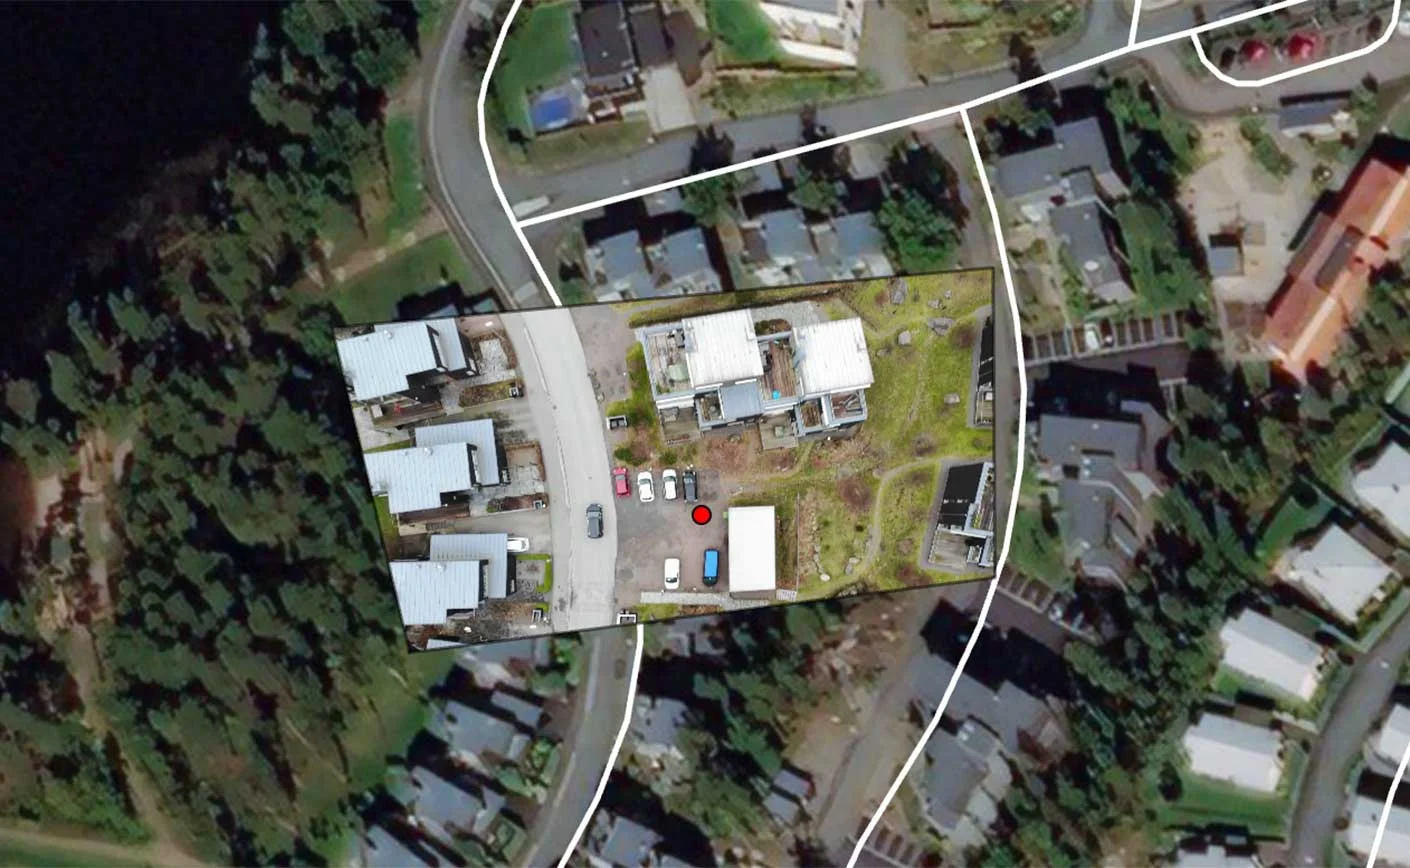
The visibility index analysis shows the best observer positions for the target area (the red rectangle). Green marks a position with good coverage, red a position with poor coverage. Real-time line-of-sight analysis is shown in bright red within the red rectangle.
Make your visibility analyses more accurate by integrating custom propagation models such as:
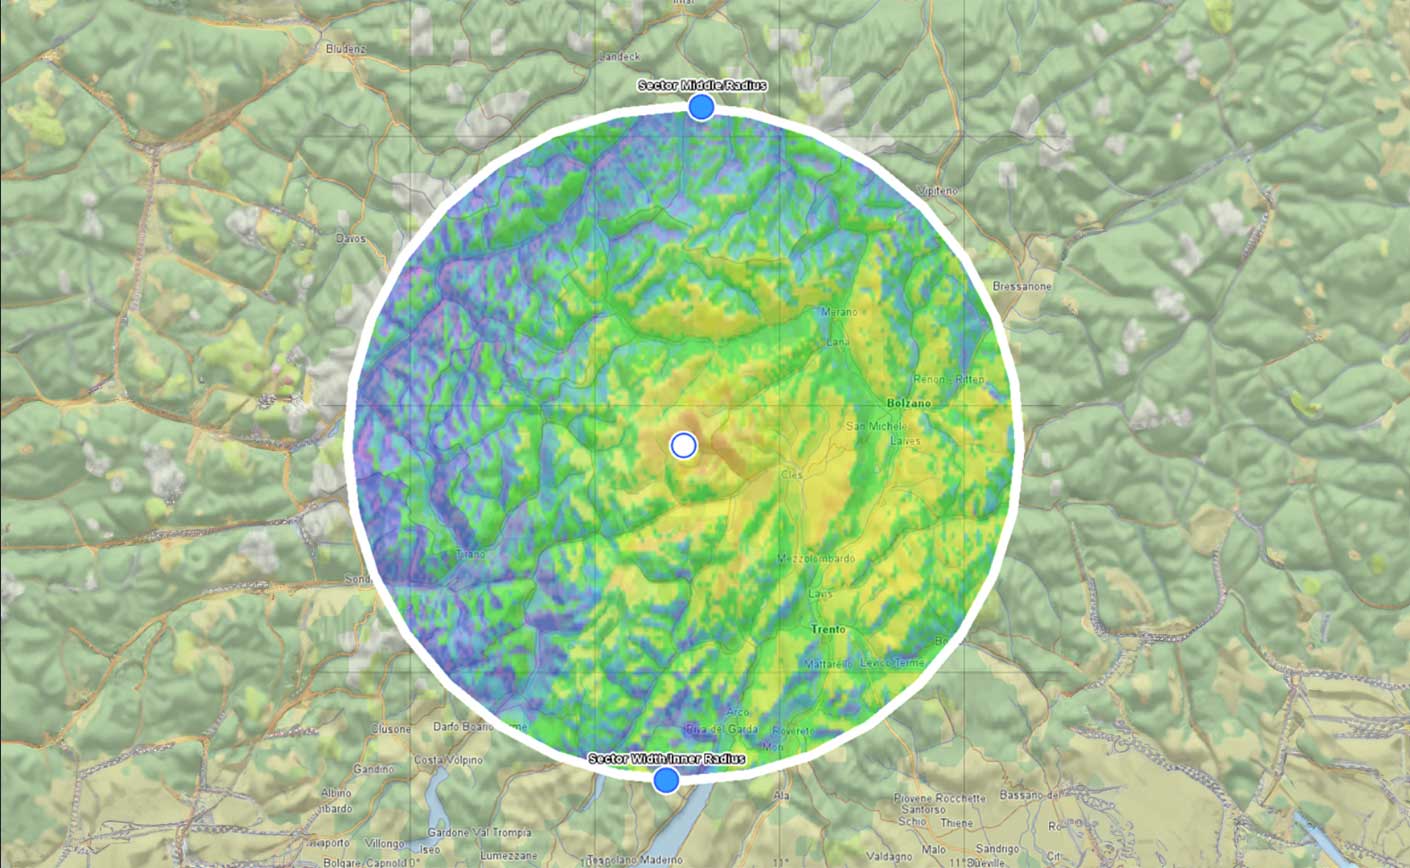
Radio propagation as an example of a custom propagation implementation. Each colour reflects how strong the radio signal is at that location.
By integrating and analyzing data from live sources, air defense and C-UAS operators can further enhance their understanding of the airspace in real-time, allowing them to make informed decisions and respond effectively to any emerging threats or incidents.

Drone video is projected onto the map, based on the camera properties. (Aerial photo from Bing Maps).
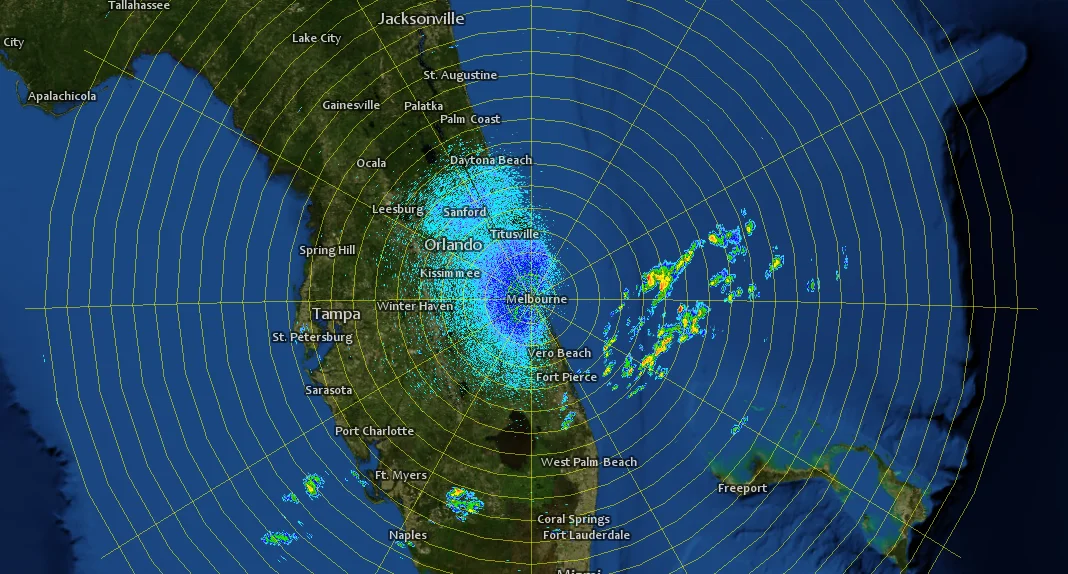
Radar videos with radar plots on top.

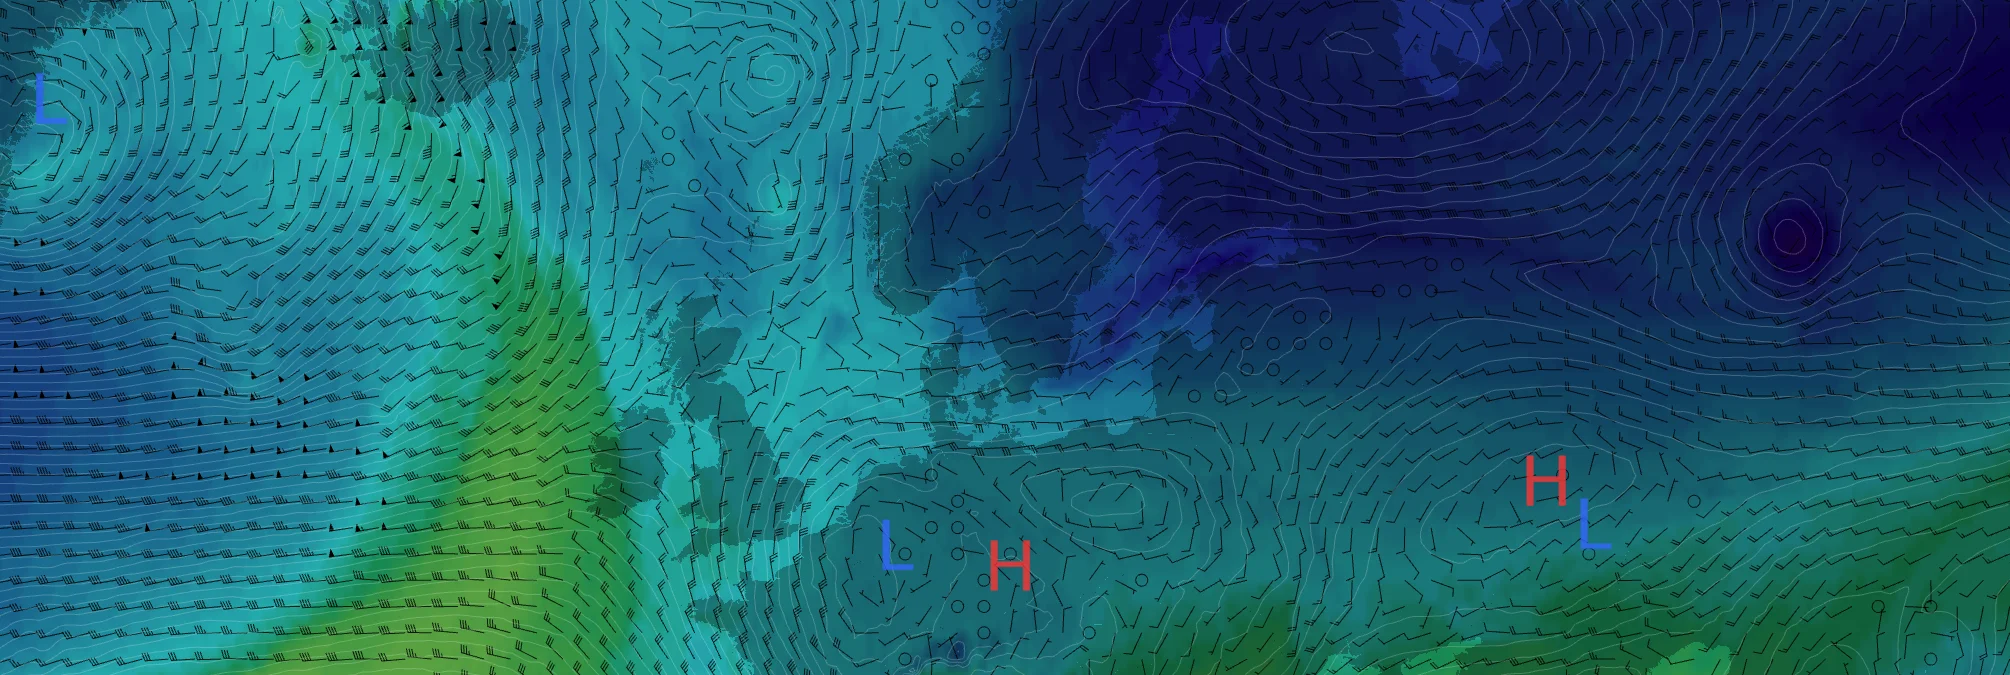
Example visualization of Grib weather information.
Are you ready to see how our products can transform your work? Request a free trial today and explore the full potential of our geospatial technology.
Please specify which product/products you are interested in.
This form can be used to request a trial for: