Making visibility visible
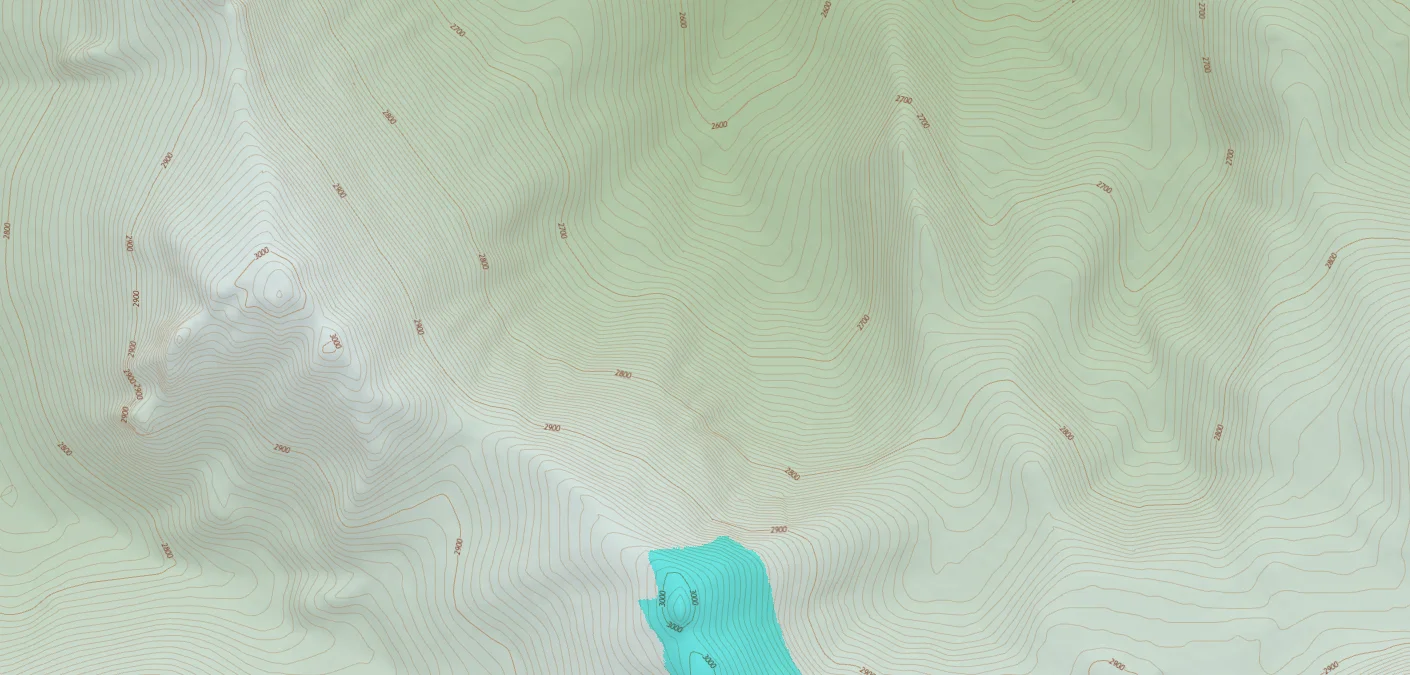
Elevation data is information about how the height of the terrain changes over a certain geographical area, and it is often used when creating map presentations. This data can be visualized in several ways: By using different colors at different elevation levels, by using isolines at different elevation intervals, by shading different slope directions to simulate the effects of sunlight or by using a combination of these methods. Read the article to learn more.