Making Visibility Visible

Geographical data can be used to create all sorts of map presentations as synthesized representations of reality. Adding analyses to the process can enhance our perception of this reality.

Here we will look at how elevation data analyses can be used to “visualize visibility” and, in doing so, provide important insights.

Elevation data

Elevation data is information about how the height of the terrain changes over a certain geographical area, and it is often used when creating map presentations.

This data can be visualized in several ways: by using different colous at different elevation levels, by using isolines at different elevation intervals, by shading different slope directions to simulate the effects of sunlight or by using a combination of these methods.

Elevation data presentations.

Visibility from elevation data

This information can be useful when navigating the mapped area to find a suitable path from point A to point B, such as in orienteering. But it can also be used for sight analysis to determine the area that is visible from a certain position.

This visible area is called a viewshed. The video below highlights the viewshed for a single observer in the color cyan.

Areas visible to single observer.

Viewshed intersection

Now consider a scenario where two units need to keep a line of sight in order to communicate. When moving, each unit needs to make sure it stays within the other’s viewshed.

In the next video we have added a second observer and highlighted its viewshed in yellow. The intersection of these two viewsheds (the area visible to both observers) is coloured green. As long as the two observers stay within the green area, they will keep a line of sight.

Intersecting viewsheds, green areas visible to both observers.

Deriving insights

We can take this a step further. By combining the two units’ viewsheds, we can prepare for a scenario where their line of sight is obstructed by a ridge or other large obstacle.

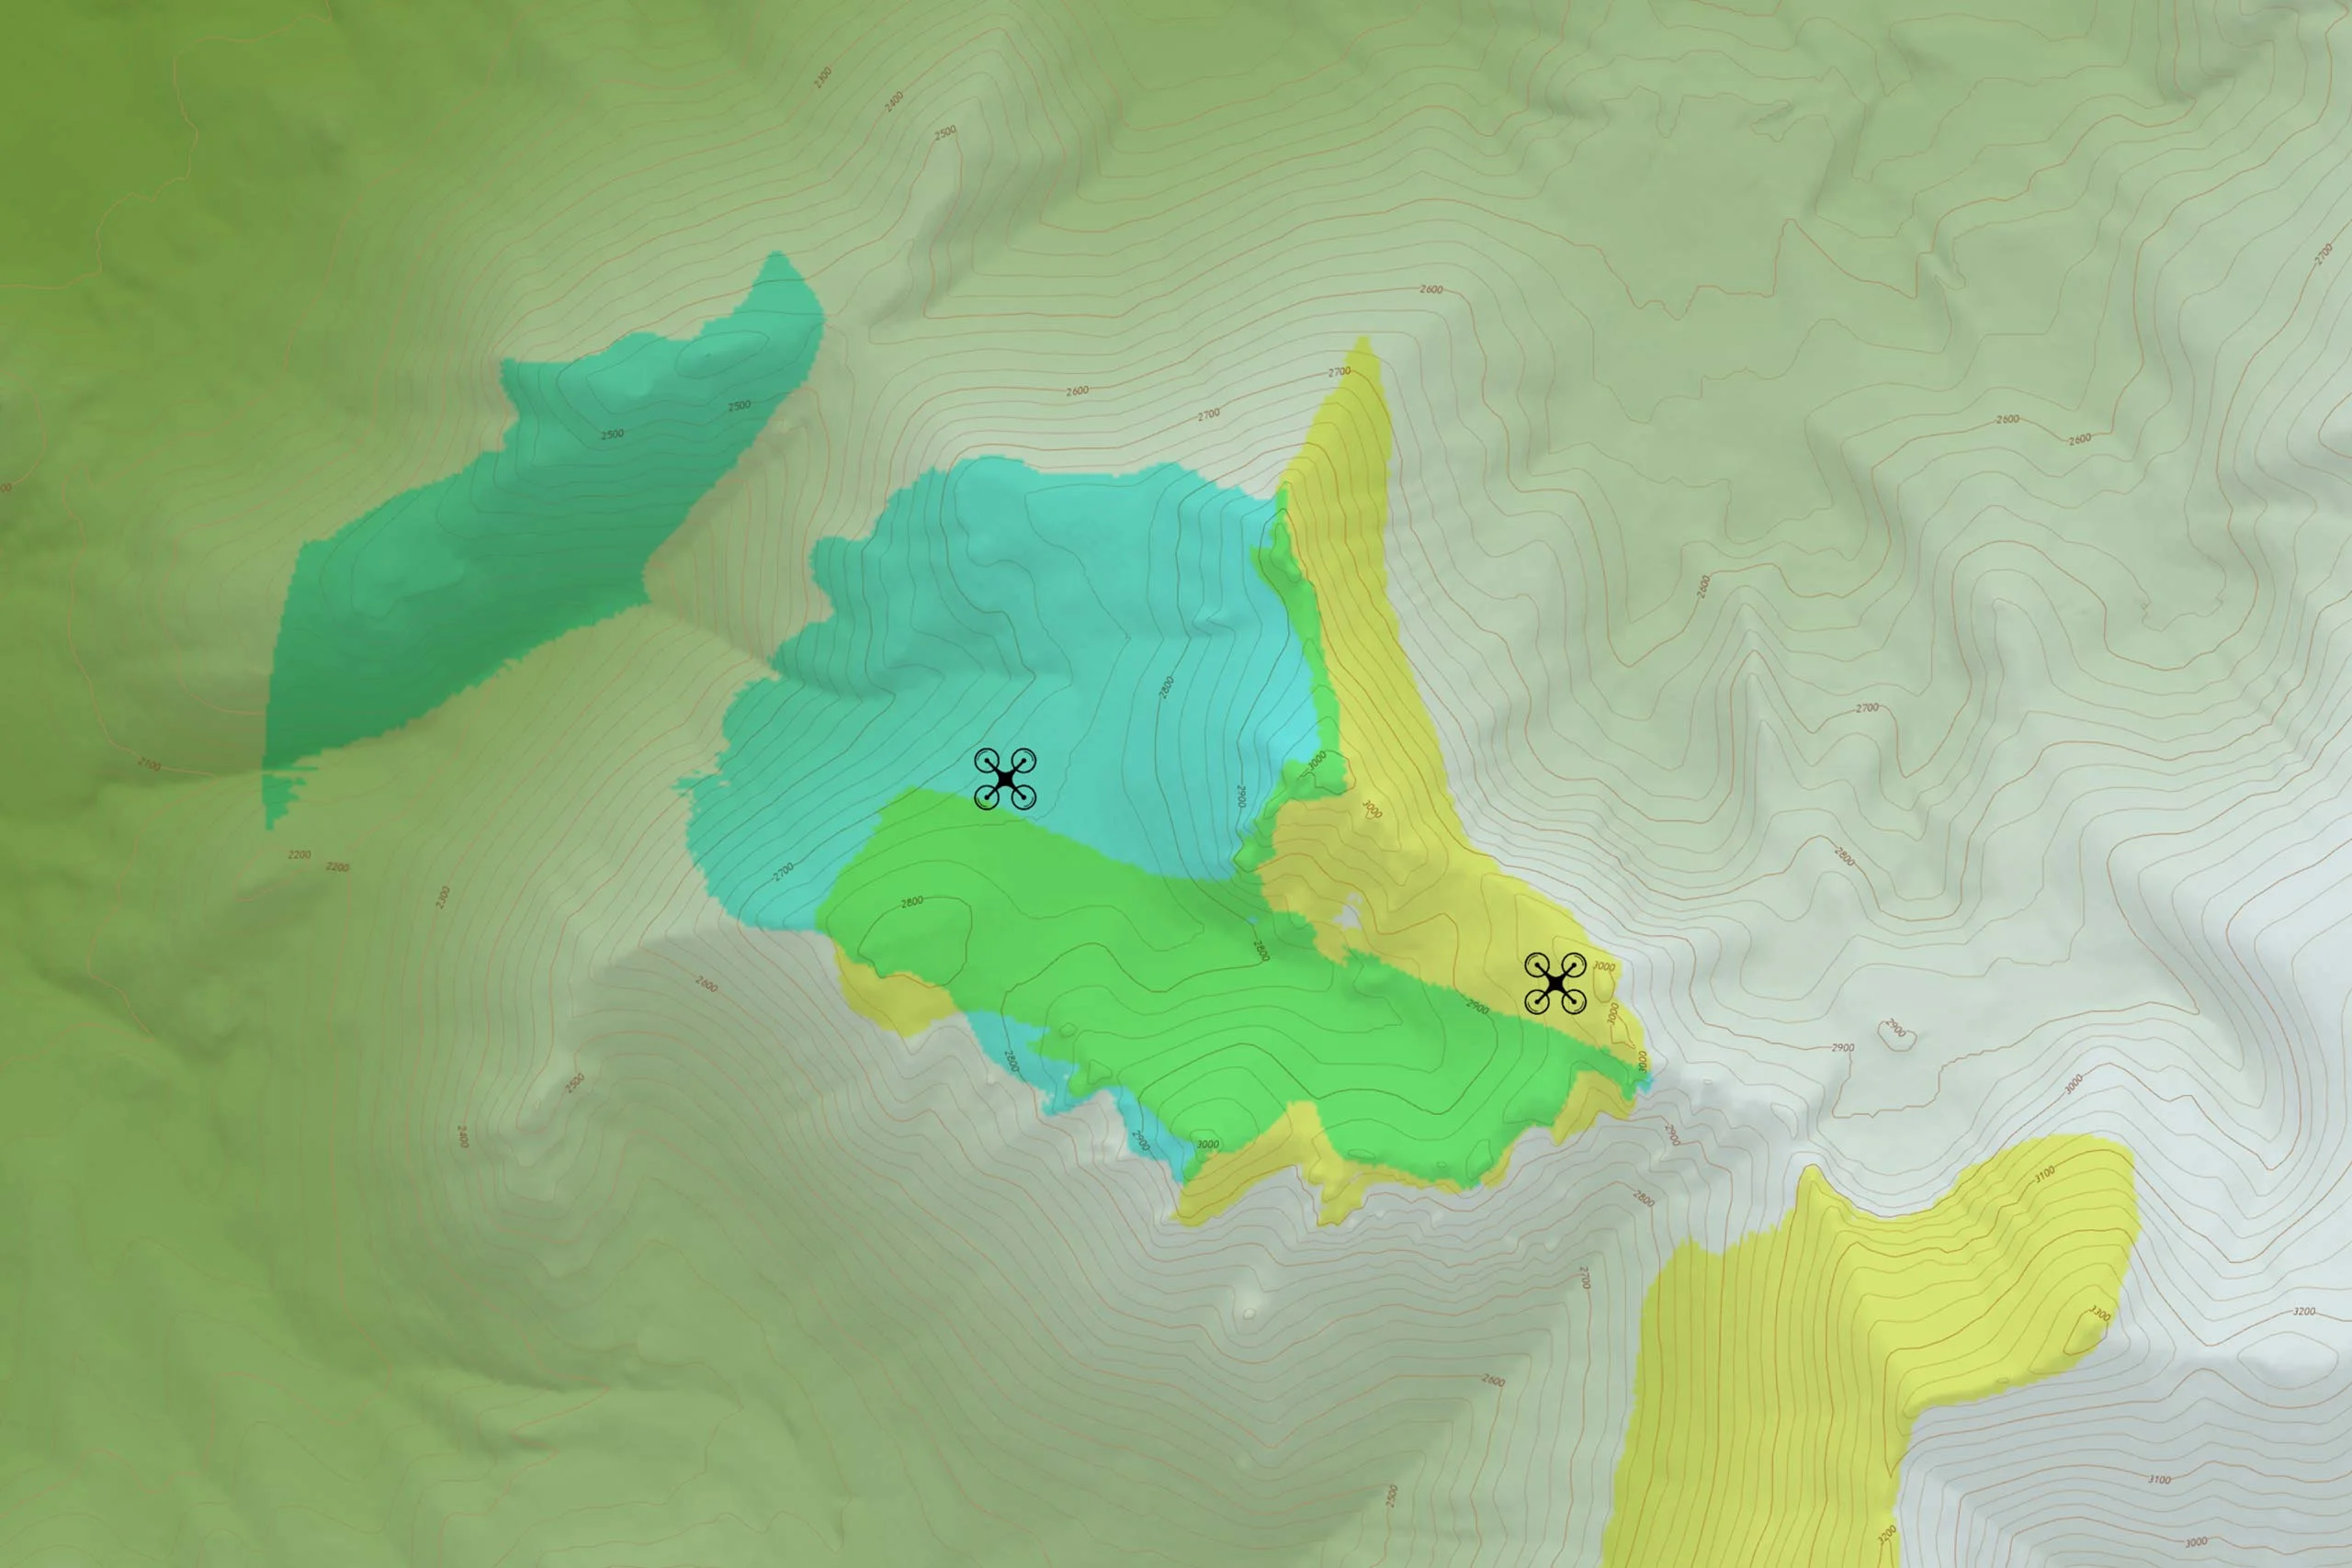
In this case, a third unit such as a drone could act as a bridge between the other two. In the video above, two vehicles are moving along two roads parted by a ridge. These vehicles are not in each other’s line of sight, but there is still an overlap between the two vehicles’ viewsheds; this intersection is coloured green. By flying two drones over the ridge, we can bridge the connection between the two vehicles.

The open line of sight is displayed on the video as lines running between vehicle and drone. In a live scenario, we can use viewshed intersections, made visible through real-time line-of-sight analysis, to determine where to relocate our drones. If they keep within the green area, the drones will have a line of sight to both vehicles, enabling us to maintain the connection between them.

Drones bridging line of sight connection between two vehicles.

Made-to-measure

Using elevation information and leveraging the real-time visibility analysis capabilities of Carmenta Engine, we have constructed a live view giving us valuable insight into this scenario. These capabilities are highly flexible and can be configured for any scenario.

If you are interested in learning how you can use Carmenta Engine’s versatile toolbox to build the perfect visibility analysis presentation for your end users, please contact our friendly sales team.