Next Post
Geographical Coordinates in a Carmenta Engine workflow
Explore how Carmenta Engine manages geographical coordinates with efficient CRS transformations. Includes advanced use cases and best practice guidance.
View Post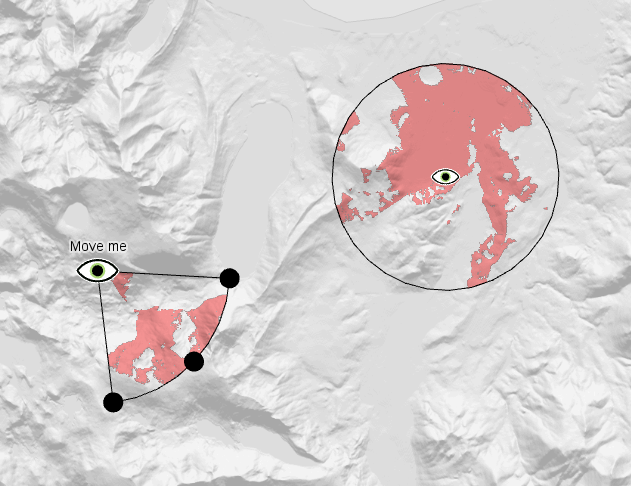
Analyzing visibility within a geographical area is often key for a better understanding of the environment. Line-of-sight coverage analyses are often applied to highly dynamic objects with varied characteristics, such as a set of sweeping security cameras in an urban environment, a soldier with a pair of binoculars, or radar systems and other sensors. This guide will help you configure the visibility operators in Carmenta Engine to tackle your specific use cases and handle dynamic application data.
For an introduction on the different visibility analyses available, you can read the Visibility Analysis article in the Carmenta Engine SDK documentation. For this guide, we will use the LineOfSightOperator in a 2D view to get an easy example, but keep in mind that the behavior of the other visibility operators is the same. There are some additional data inputs that will need configuring, and the results you get are different, but the core concepts of dynamic visibility analysis are the ones presented in the following sections.
The map configurations and sample code mentioned in this article can be downloaded through this link: DynamicVisibilityAnalyses.zip
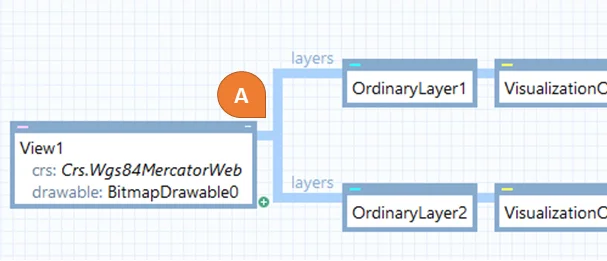
Most Carmenta Engine analyses are available as operators to insert into a map configuration file. The LineOfSightOperator is no exception, and building a basic line-of-sight configuration starts with attaching a Layer, a VisualizationOperator and the operator itself to your View. For performance, make sure that you use an OrdinaryLayer with the cacheMode property set to DynamicAsync.
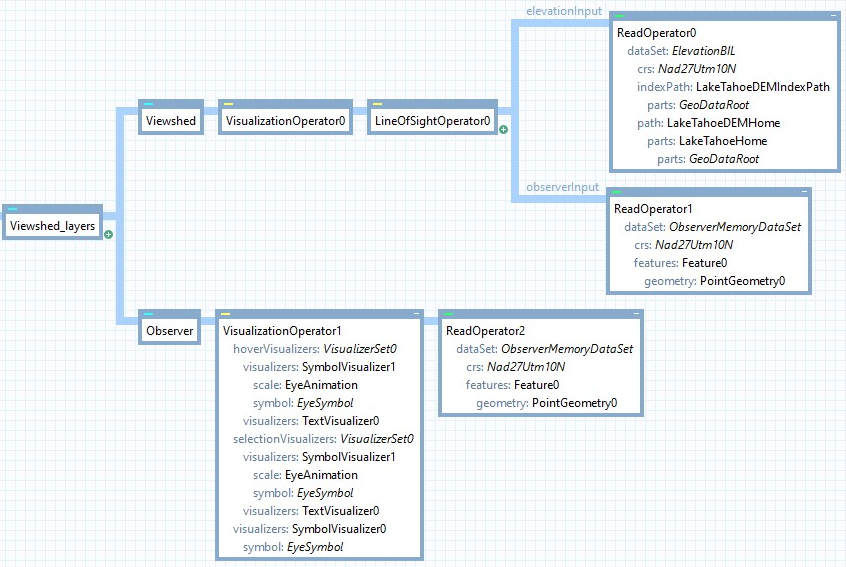
There are two mandatory inputs to a line-of-sight analysis, as shown by Carmenta Studio. See start_configuration.px.
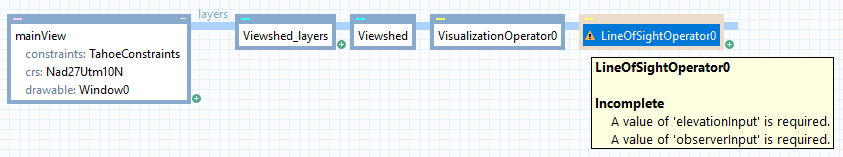
The start configuration
Elevation input
The first input is the elevation data that describes the terrain. The varying terrain elevation will set a limit to how far we can see in different directions. This input should provide a set of rasters with float or integer values of the ground elevation above sea level.
Elevation data, also called Digital Elevation Model (DEM), is a widely used type of geographical data, which comes in many forms, from many different providers. In this example, we will use the elevation data over Lake Tahoe provided with the Carmenta Engine samples, which can be read using a HdrDataSet. The dataset should be configured with the path to the data, an index path, and a raster cache for performance. Finally, a simple ReadOperator is enough to connect this data source to the elevationInput of the LineOfSightOperator.
Usually, you will also want to add one or more layers to the background TileLayer to visualize the elevation data itself. This helps give some context to the resulting visibility analysis. Elevation data is often represented by a hillshading effect, generated using a ShadeOperator. It can also be visualized by isolines (contour lines), colorized altimetry, and so on.
See elevation_input.px.
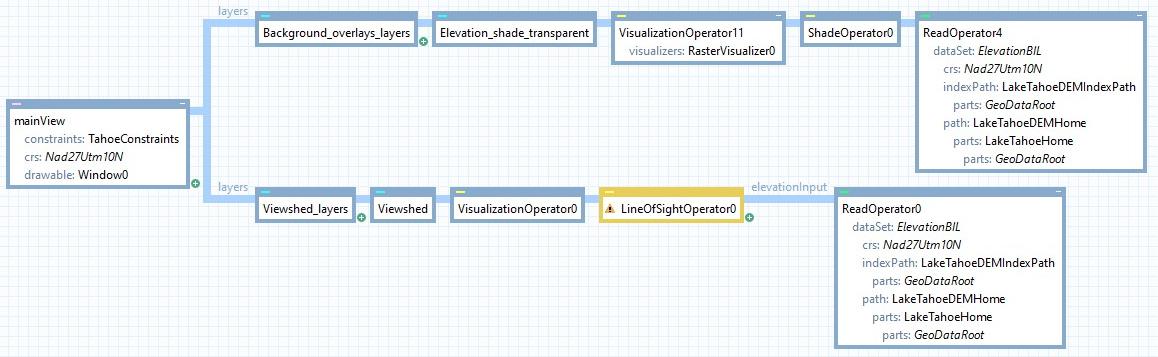
Setting up elevation input and visualization
The observer is the more dynamic part of the visibility analysis. This is your dynamic application data that describes what will be observing the terrain and where it is observing from. It can either be created and updated in the application via a MemoryDataSet or be read from a database using a DatabaseDataSet. We will use a MemoryDataSet, connected to the LineOfSightOperator via a ReadOperator.
The observers themselves are Features inside the dataset, with a PointGeometry representing their geographical location. It is good practice to insert such “dummy” features in the dataset in Carmenta Studio, to be able to test the whole map configuration in Carmenta Explorer, even though you will replace it from application code at a later stage.
By default, the LineOfSightOperator is configured to interpret all observer features as being ground-based, and therefore the altitude, the Z coordinate, is ignored. The operator will automatically elevate the features to ground-level before calculating the viewshed.
Similarly to the elevation data, the observers also need a visualization to be displayed on the map. Which visualization is up to you: it could be a simple circle, or a tactical symbol, or something else, based on what you want to represent. But more importantly, if you want to be able to interact with the observer, and see how its line-of-sight dynamically changes when the observer moves around, you should add selection visualizers for the observer as well as mark the layers as selectable.
See observer_input.px.
Setting up observer input and visualization
The output of the line-of-sight analysis is often called a viewshed and is by default generated as a raster. To display a 2D line-of-sight viewshed, you must attach a RasterVisualizer to the VisualizationOperator.Visualizers. By default, the viewshed rasters will contain zeros where the ground is visible and positive numbers elsewhere, so the color table can simply contain two entries, 0 with the chosen color for visible parts of the terrain, and 1 with a fully transparent color.
On the RasterVisualizer, an alpha is usually set to make the viewshed partially transparent. For such transparent rasters to blend in with the background maps instead of simply be displayed on top of them, the blendMode property on the OrdinaryLayer can be set to Multiply. Additionally, the RasterVisualizer filter can be changed to smooth out the visualization, regardless of the alpha.
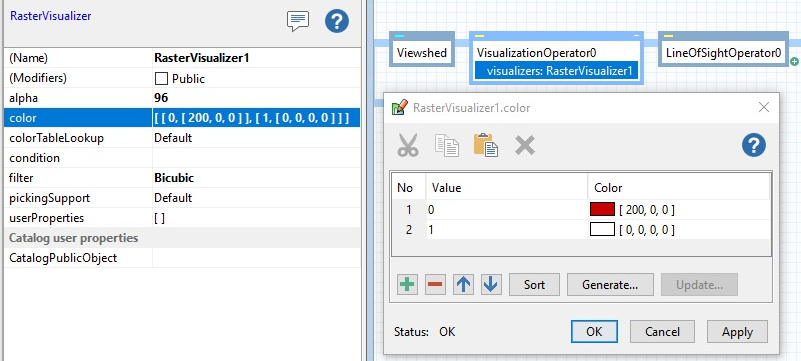
Setting up the RasterVisualizer
Once the visualization is set up, as well as both elevation and observer inputs, the basic line-of-sight can be displayed in Carmenta Explorer. Selecting and moving the observer around allows analyzing how its visibility changes based on its location.
See basic_line_of_sight.px.
Basic line-of-sight
So far, we’ve been working with the default property values of the LineOfSightOperator, which are fixed values in most cases. For example, the range of the observer, the maximal distance it can see, is defined by the maxDistance property, set to 15000 meters by default. This fixed value will be applied to all observers coming in from the observerInput. If you change the value, it will change for all observers.
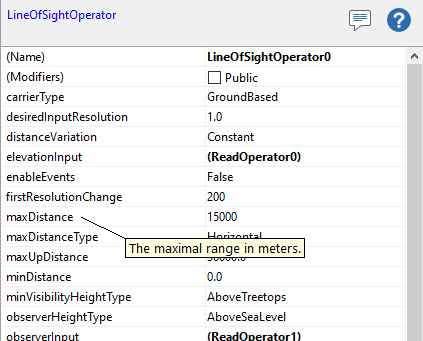
LineOfSightOperator properties
However, in your application, the value of these properties will depend on your use case and will most likely be different for different observer objects. For example, you might have a mix of long-range ground-based cameras, and of short-range airborne UAVs flying around. The next important step is to configure the visibility analysis to read these properties dynamically from the attributes of your Features.
There are two main steps to achieve this: setting the attributes you want to use on the Features, and configuring the operator to read these attributes.
Attributes can be defined in different ways. We can read attributes from a data source, create them in application code or set them in a map configuration file. In this example, we will simply add a RANGE attribute of 3000 meters to the first “dummy” Feature in our configuration. We will also create another Feature with a different RANGE, and additional DIRECTION and WIDTH properties.
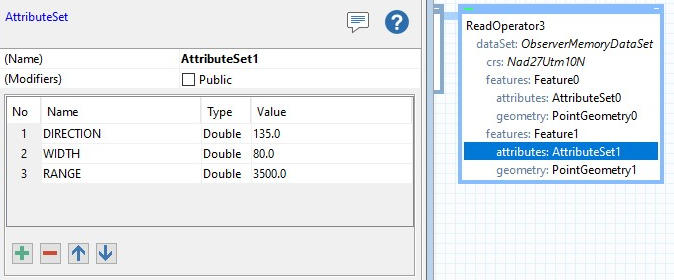
Setting up Feature attributes
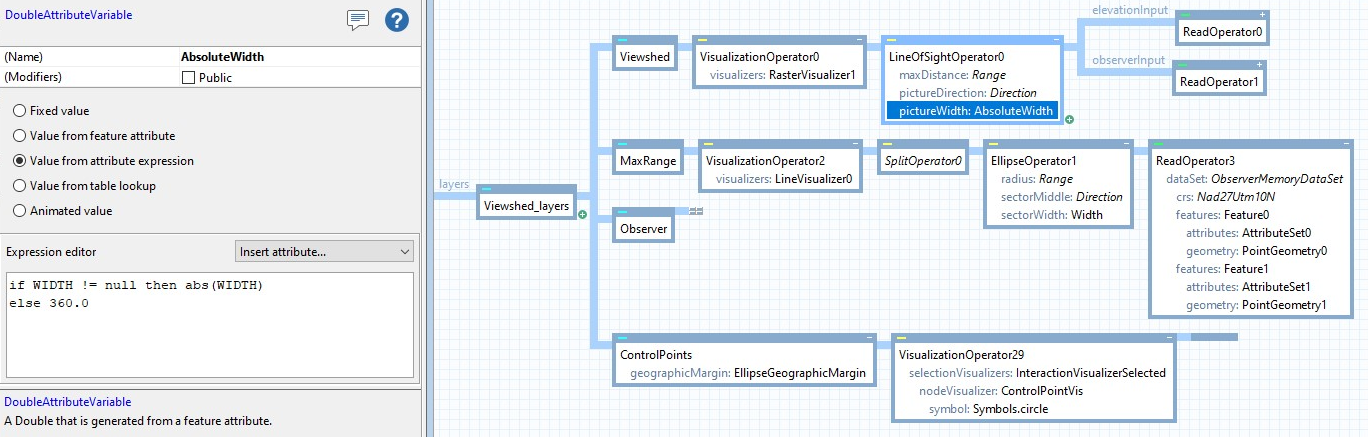
The more important part is to set up the LineOfSightOperator to make use of these properties. The simplest and most common way to do this is by using AttributeVariables for each line-of-sight property, configured to read the property value from the specified feature attribute. For example, a DoubleAttributeVariable can be assigned to the pictureWidth property, defining the size of the line-of-sight sector. This one can be set to read the WIDTH attribute if it exists, and to default to 360 degrees otherwise, like for the first Feature which only has a range.
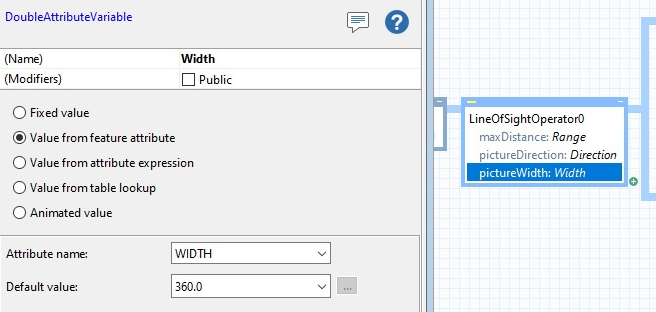
Setting up attribute variables
The advantage of working with feature attributes is that they can easily be used in different contexts to dynamically control properties of operators. For example, a layer with an outline for the viewshed sector is a common part of a line-of-sight presentation, used to indicate the maximum range and capabilities of the observer. This layer can use an EllipseOperator with MiddleAndWidth as sectorDefinition, and reuse the same attribute variables, to display such information.
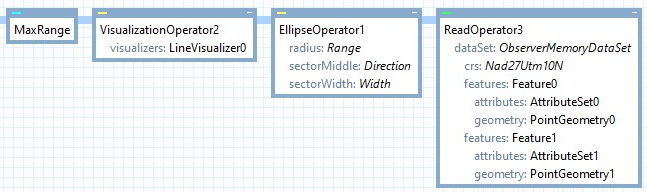
Setting up the sector outline via an EllipseOperator
Once the different properties are configured, the LineOfSightOperator can display the viewsheds for the different observers based on their individual properties.
See attribute_controlled_line_of_sight.px.
Attribute-controlled line-of-sight
There are many different configurable properties on the visibility operators, which can be used to model the observers to match your use case. Have a look at the article Properties of the Sensor in the Carmenta Engine SDK documentation for a description of the properties.
The position and properties of an observer, or more generally of any application data used in the visibility analysis inputs, will likely change throughout your application lifetime. This change can come from setting the properties from code, or from the user interacting with the map, or a combination of these mechanisms. Either way, as long as the visibility analysis is set up to read properties from the feature and its attributes, these changes will be easy to handle.
Let’s go through two typical use cases when working with line-of-sight.
Letting the user interact with the objects directly through the map can be a great way to give them the freedom to analyze the data in the way they want, without having to create too many user interfaces. Editing the size and direction of the line-of-sight viewshed is the perfect example of such map interaction.
Thanks to the support for Interacting with Ellipses in the Carmenta Engine Standard Tools, setting up handles, also called control points, along the sector outline, is straightforward. When interacting with these handles, Carmenta Engine will automatically update the values of the attributes on the observer Feature being edited.
The EllipseOperator which we already use for the outline simply should be reused into a new layer for the control points. This can be done with a simple SplitOperator. After that, there are a few things to take care of:
Setting up the viewshed control points
The result is a map where handles appear on the sector outline for a selected observer. Interacting with a handle will change both the sector outline size, and the associated visibility analysis.
See interactive_line_of_sight.px.
Interactive line-of-sight
Map interaction is useful for giving freedom to the user, but the scenario is often data-driven where the properties are updated from application code. A typical example is a mobile observer, like a mounted camera on a vehicle or a drone. In this case, usually both the observer position and the direction of the camera change at every step.
In this example, the observer is moving along an itinerary line, and the movement is simulated through a timer. At each timer tick, the new observer position is calculated based on a defined speed. Additionally, the heading of the observer carrier is also calculated based on the current itinerary segment being followed, so that this can be used to update the direction of the viewshed.
// Find the point on the line matching the distance we covered since the first node.
double observerCoveredDistanceInMeters = ObserverSpeed / 3.6 * simulationTime;
Point destination = line.PointAlongLine(0, observerCoveredDistanceInMeters, out _, out double azimuthInRadians);

// Compute the azimuth of the line segment matching the node previously found.
// Azimuth in radians: counterclockwise from right. Direction in degrees: clockwise from up.
double direction = -azimuthInRadians * 180.0 / Math.PI + 90.0;
The feature’s geometry and direction attribute are then updated, so that the line-of-sight is updated on the map. Be mindful of the RefreshFeaturePresentation call when working with Dynamic cache mode!
using (new Guard(observerDataSet))
{
           observer.GetGeometryAsPoint().Point = destination;
           observer.Attributes["DIRECTION"] = direction;
           observerDataSet.RefreshFeaturePresentation(observer, false);
}
Since the configuration file was already set up with attribute variables on the line-of-sight layer, only these few lines of code are necessary to update the feature, and in turn its visibility analysis. The resulting dynamic map is more realistic, in the sense that it reflects what is likely to happen, how the viewshed is likely to evolve every step of the way.
See MovingObserver sample application.
Moving observer
The sky’s the limit! You can combine these use cases and add more interaction from code, in any way you want, to match your specific requirements. Have a look at the article Making visibility visible for another example of scenario where several visibility analyses are combined to bridge the line-of-sight connection between two vehicles.
Explore how Carmenta Engine manages geographical coordinates with efficient CRS transformations. Includes advanced use cases and best practice guidance.
View Post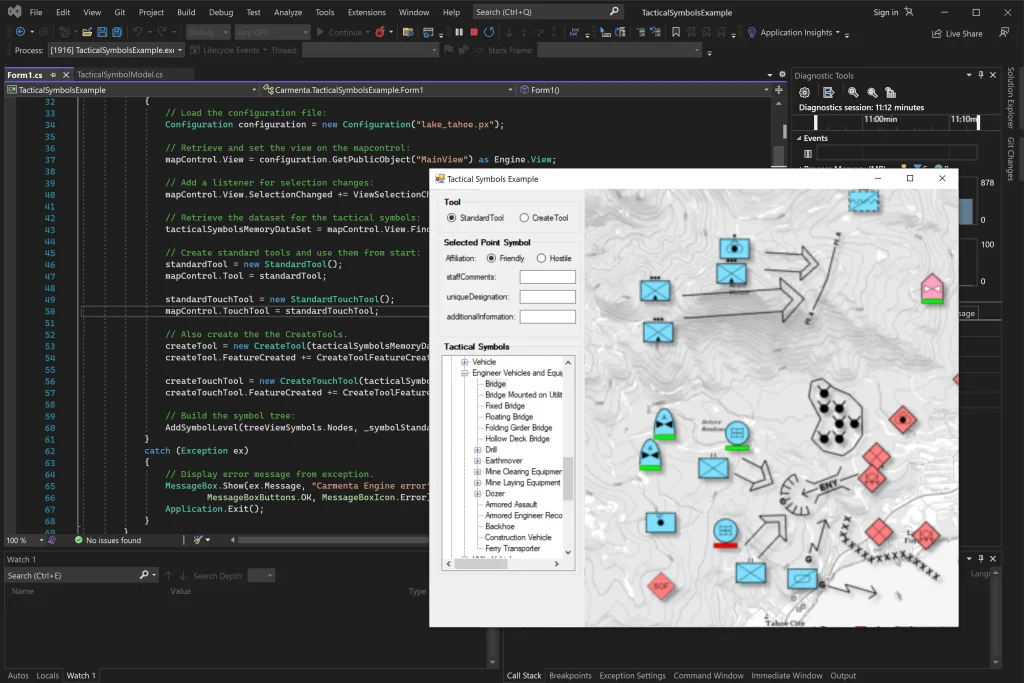
Get started with how to display and edit tactical symbols in Carmenta Engine using MIL-STD-2525 and NATO App-6 standards.
View Post