Previous Post
Land Classification
Learn how to use land classification in Carmenta Engine to visualize terrain and validate feature placement from C# with a tactical symbols sample.
View Post
Visibility analyses answer geographic questions about what can be seen, from where, and by whom. Carmenta Engine offers several operators for these analyses, each built for a different question.
The Visibility Analysis article in the Carmenta Engine SDK documentation groups these analyses around four developer questions:
This article walks through each question, the operator that answers it, and when to reach for it. A separate path uses 3D meshes instead of elevation rasters, and we’ll cover that too. By the end, you’ll have a decision matrix to pick the right tool for your scenario.
By default, all four operators assume that signals propagate along nearly straight lines (the lines curve slightly downward to model atmospheric refraction). If your scenario needs something more involved, like a radio path-loss model that varies with terrain, you can plug in a CustomPropagation instance and the operator will run your code along each vertical profile.
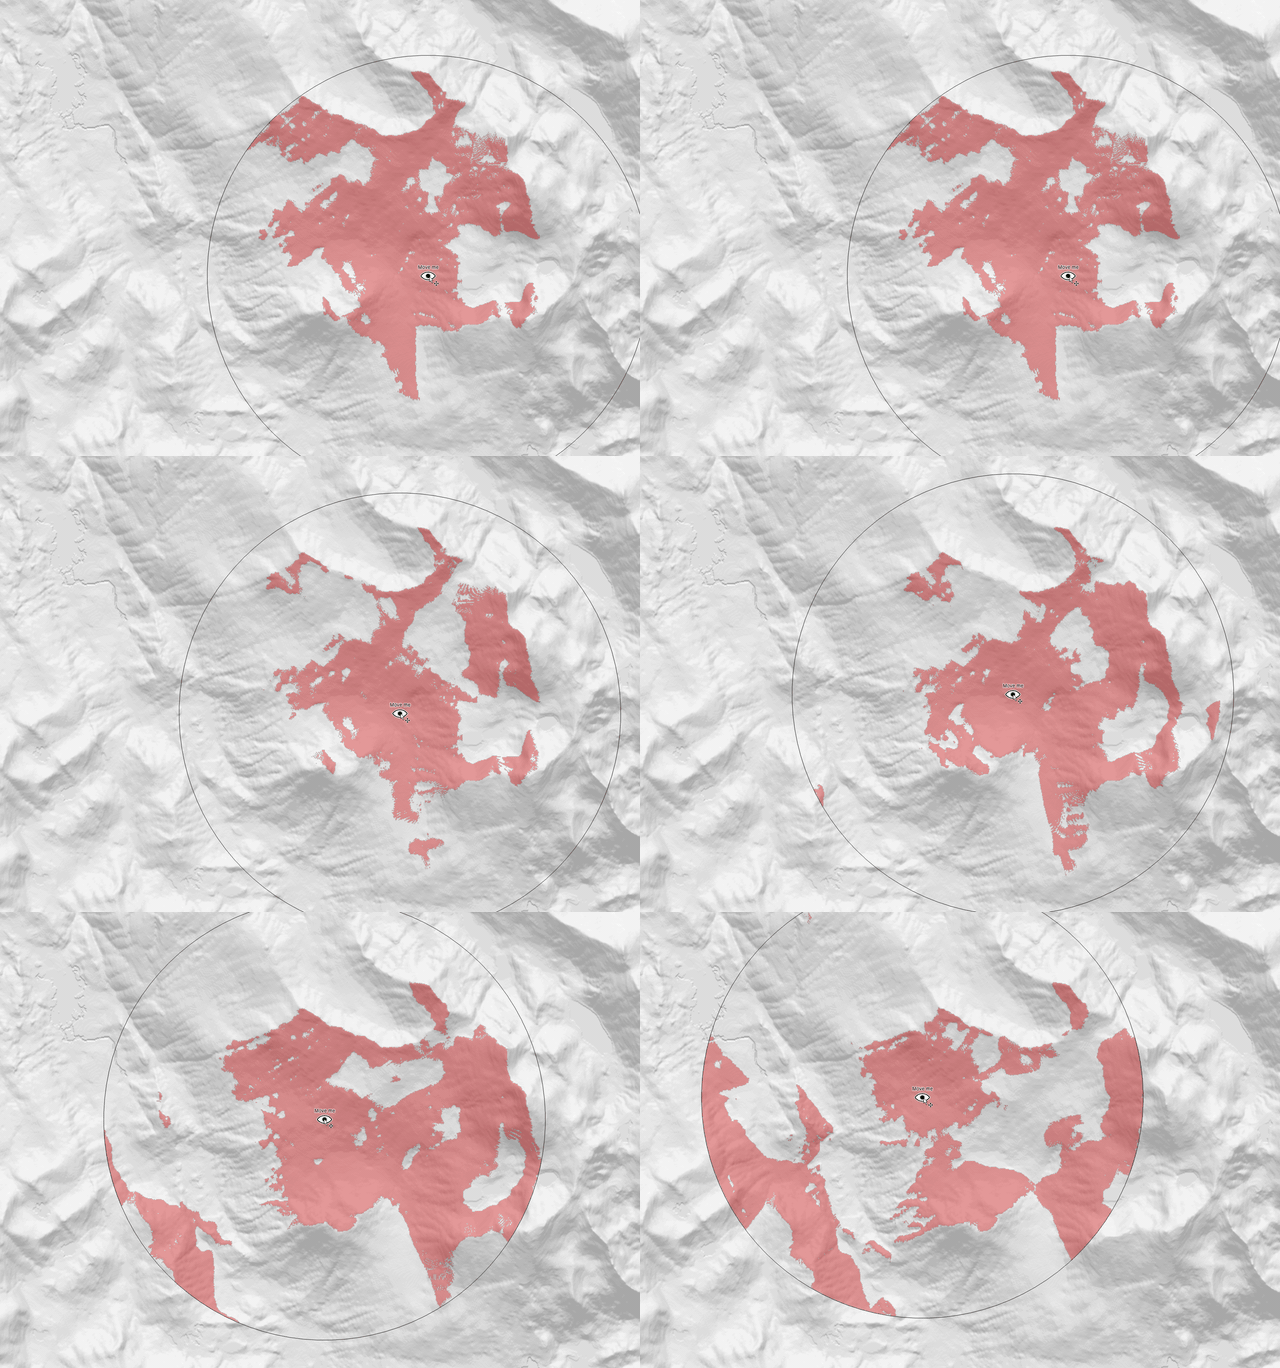
The LineOfSightOperator is the foundational visibility analysis: given an observer position, it computes the viewshed, the area visible from that observer. This is the operator most developers reach for first, and it answers the most common visibility question.
It needs two inputs: an elevation raster (a Digital Elevation Model providing terrain heights) and one or more observer features. Observers are typically point features in a MemoryDataSet, but lines work too. The default output is a minimum visibility height raster: each cell holds the minimum height above ground an object would need to be visible to the observer. Cells where the ground itself is visible hold zero, which a RasterVisualizer can style with a semitransparent color so the visible area pops against the rest of the terrain.
The same operator covers both 2D and 3D analysis. By default, it produces minimum visibility height rasters for the viewshed surface (the 2D viewshed). Enable outputVolumeMesh and you also get a 3D mesh for a GlobeView. Enable outputVolumeEncodingRaster and you get a volume raster that feeds a VerticalProfileOperator.
Example use cases include radar coverage, surveillance camera placement, observation post planning, and anything else that boils down to one observer and a piece of terrain. Open line_of_sight.px to see the operator in action.
For a much deeper dive into binding LineOfSightOperator properties to dynamic application data, see the existing article Dynamic Visibility Analyses.
When the points of interest are already known, computing full viewsheds is overkill. The TargetLineOfSightOperator inverts the question: instead of “what is visible from this observer”, it asks “is this specific target visible from any observer”.
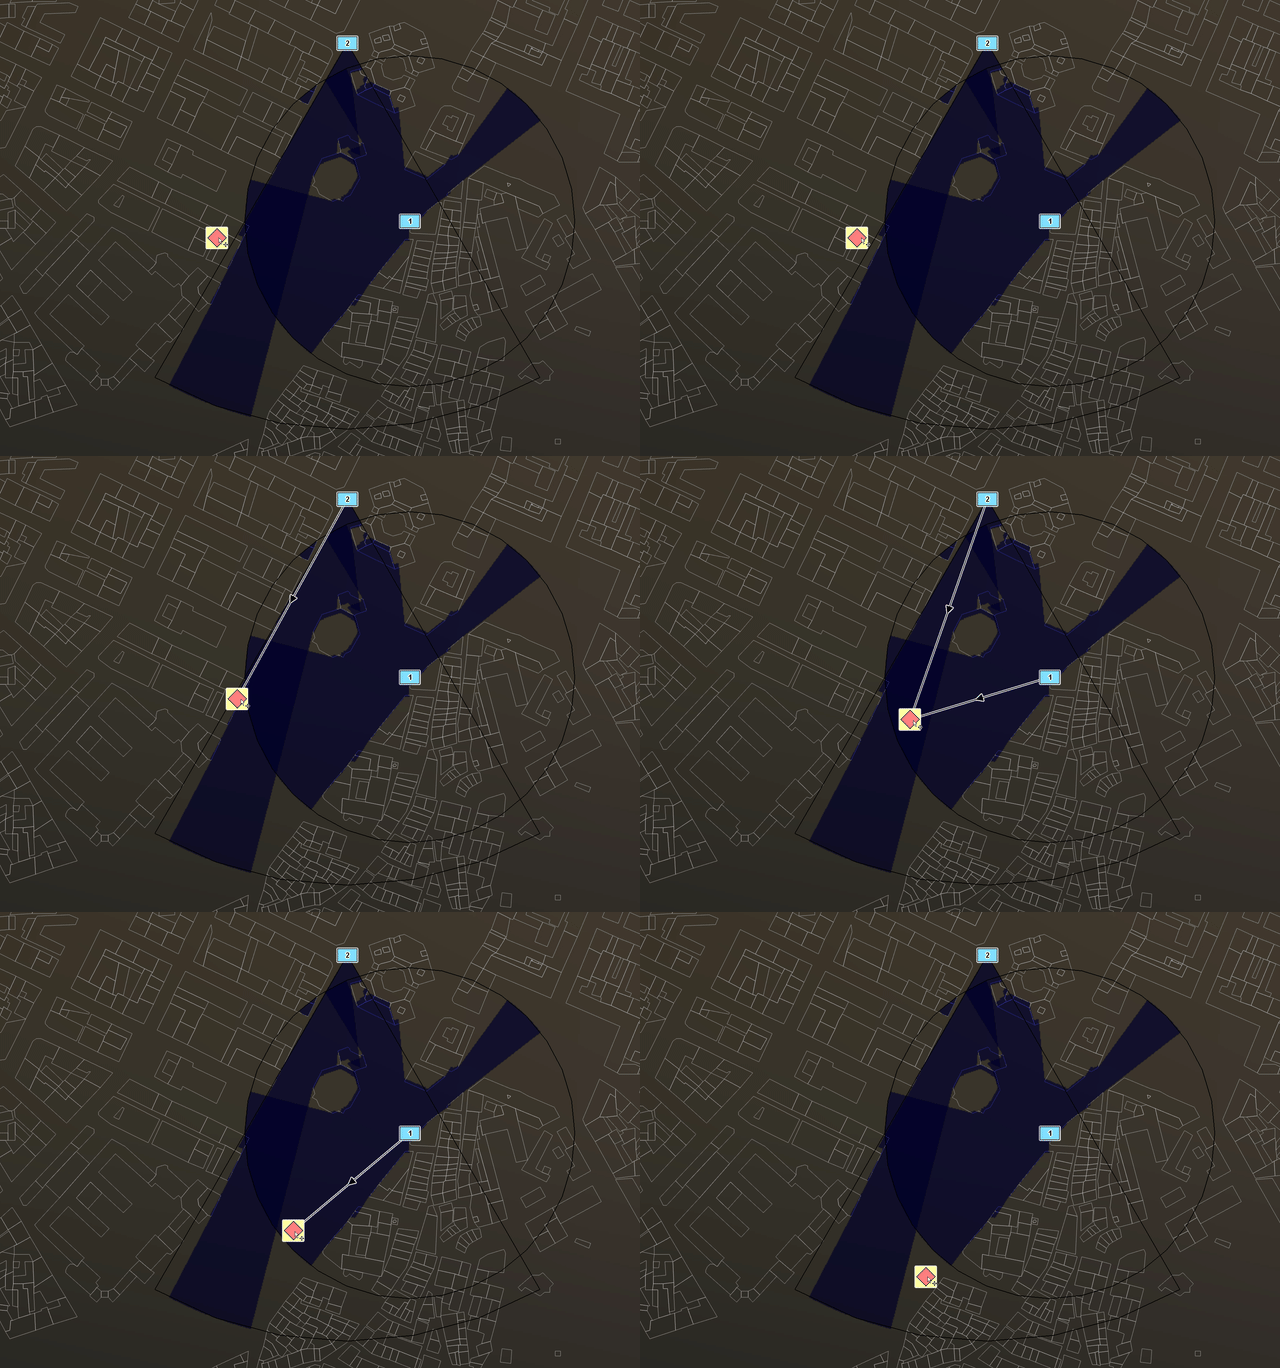
It takes three inputs: point observers, point targets, and an elevation raster. You get back a copy of each target feature with new attributes: seeingObservers lists the observers that can see it, visibleBy gives the total count, and per-observer-name counters can be added if you set the observerName property.
Set outputSightLines to one of the line-generation values (e.g. Line, InterruptedLine, AnyLine) and you also get line features for each observer/target pair, useful for visualizing the connection graph directly on the map. The interrupted variants draw the line up to the first obstructing terrain instead of all the way to the target.
The operator runs in one of two modes. By default, it’s binary: each observer/target pair either has a free line of sight or doesn’t. Plug in a CustomPropagation model whose output type is Other (e.g. path loss in decibels) and it switches to continuous mode, returning a real propagation value per pair instead of a yes/no.
The key distinction from LineOfSightOperator is that the output is not a raster but point features that represent the targets with added information. The output targets carry visibility metadata as ordinary attributes, which means you can label them, filter them with a Condition, or feed them downstream into another operator chain.
Use it whenever you have a known list of assets and want to know which sensors can see them, or for any connectivity check between fixed points. The sample below demonstrates a target in movement and the target line of sight from two observers.
For ground-based targets and a single observer, an application user could also simply check whether the targets appear inside the viewshed area from a LineOfSightOperator. But the TargetLineOfSightOperator can be more useful when there are several observers with overlapping viewsheds, or when the targets are airborne.
Sometimes you don’t yet know where to put the observer. You know the area you can place it in, and you know what you want it to see, and you need to find the best spot. This is where the VisibilityIndexOperator comes in.
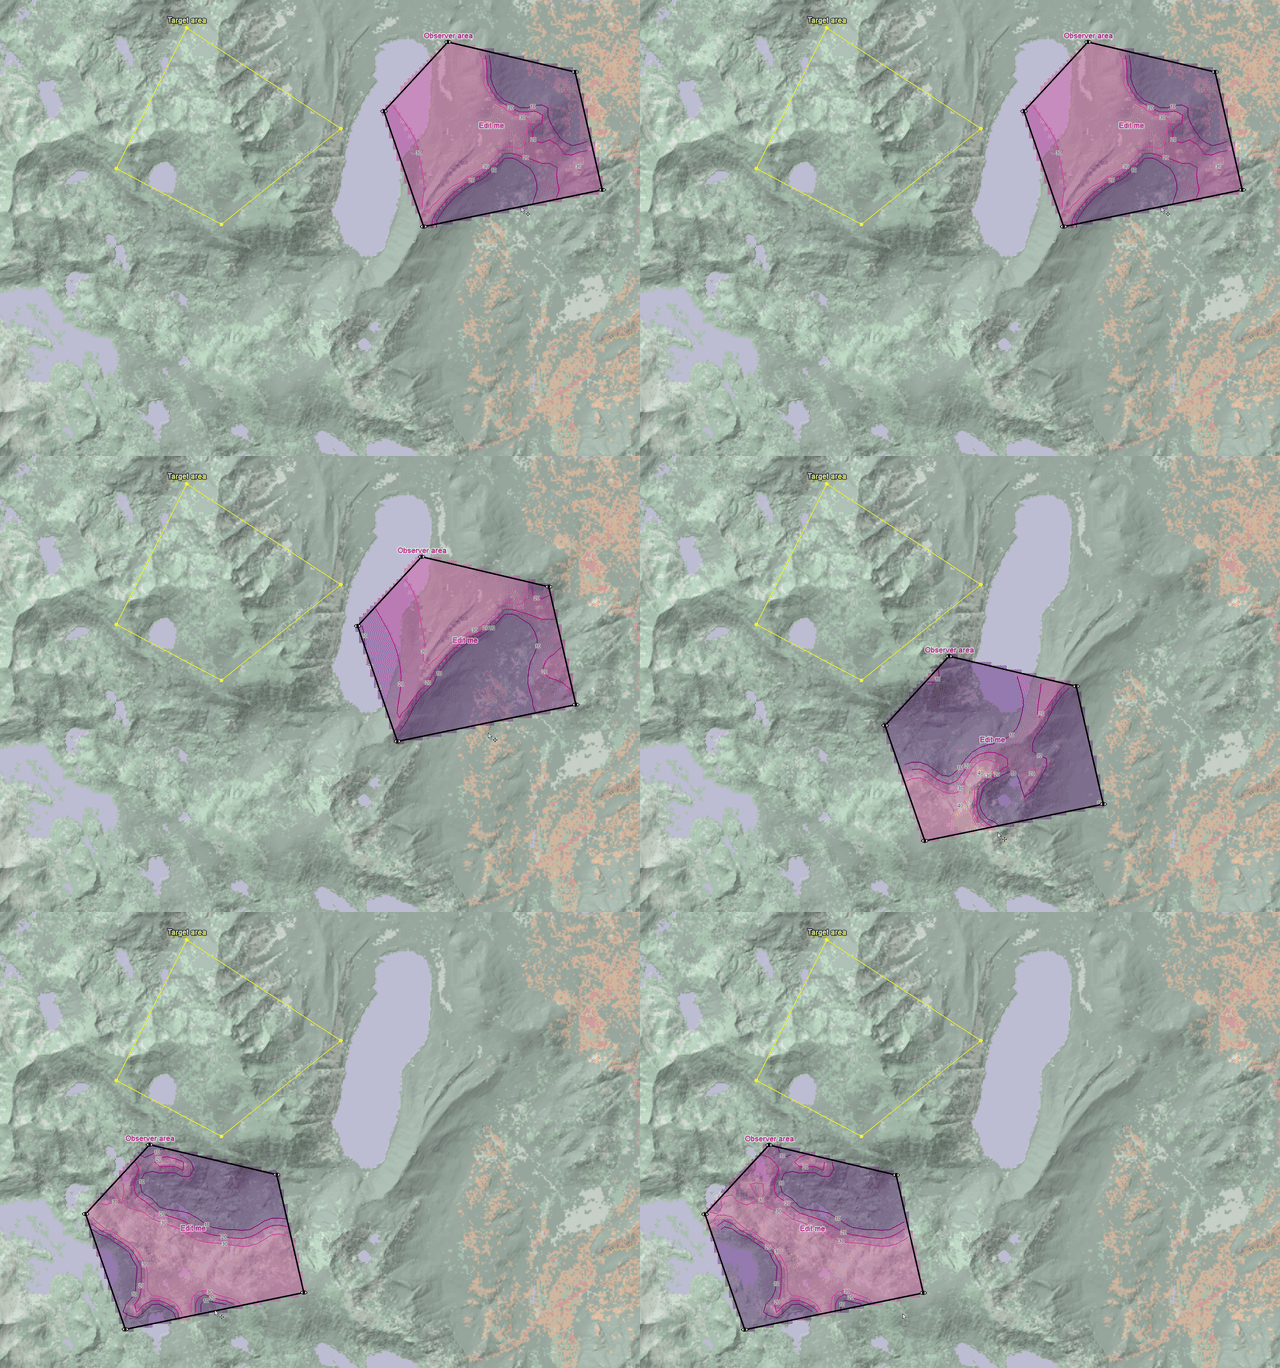
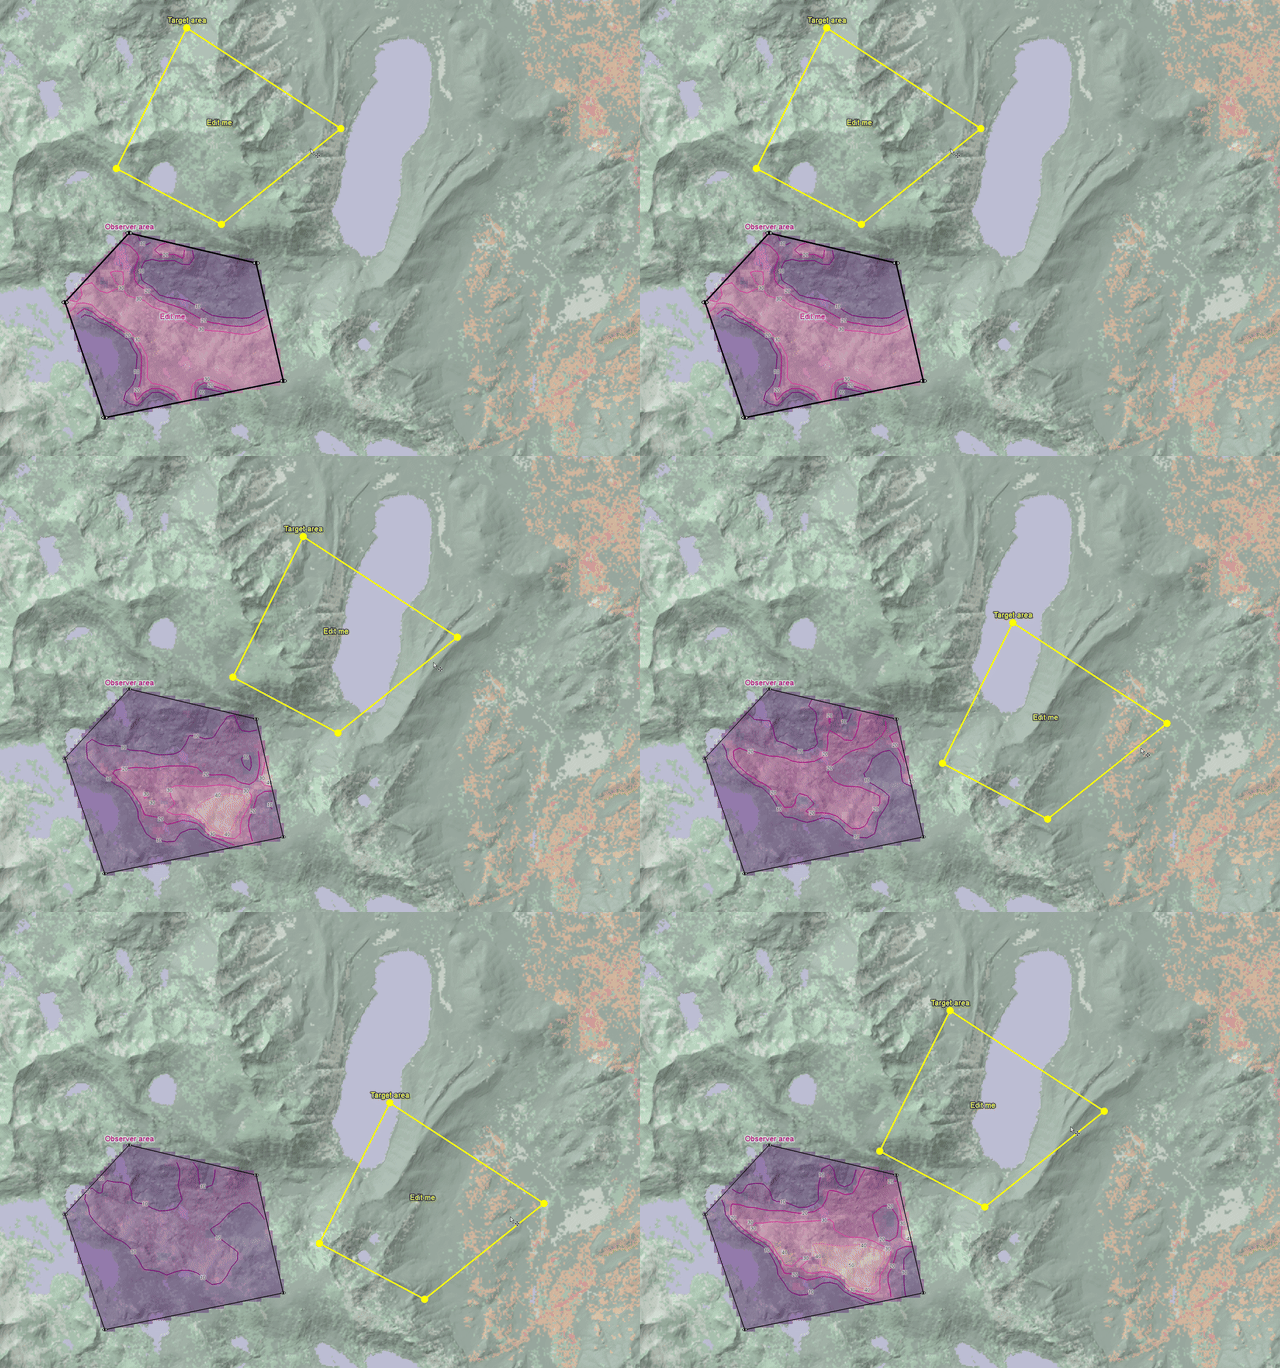
Instead of taking an observer point and producing a viewshed, this operator takes an observer area and a target area, both as polygons. The output is a raster where each cell inside the observer area carries an estimate of what percentage of the target area is visible from that cell. Cells with high values are good spots; cells with low values are poor ones.
One thing the operator needs that the others don’t: a constant targetHeight (with targetHeightType to interpret it above ground, above treetops, or above sea level). It’s how the operator decides what counts as visible at each potential target position.
This is a different mental model from the other visibility operators. You are not asking “what is visible from here”, you are asking “where should I stand to see the most”. The result is a heatmap of observer placement quality, which you can style with color ramps and isolines to highlight the best candidate positions.
This is the operator for surveillance station siting, antenna placement, and any planning workflow where the observer location is still up for grabs. The visibility_index_operator.px sample includes an example scenario.
In the first animation the observer area moves while the target stays fixed, showing how candidate vantage points are scored against the same objective. In the second the target area moves instead, showing how the same observer region scores against a different objective.
Once you have several observers, you care less about each one’s viewshed individually. You care which areas are covered by enough of them. The AirspaceCoverageOperator merges multiple viewsheds with configurable rules that go well beyond a simple union.
Set minObservers to 2 and you get the airspace covered by at least two observers. Set it to 1 and you get the union, the classic combined coverage. Add observerTypeConditions and the rules can mix observer types, for example requiring “at least one radar and one optical sensor” before a cell counts as covered.
The operator inherits all of LineOfSightOperator’s output types and adds one of its own: outputCoverageRaster. This is a floating-point raster where each cell inside the area of interest holds the proportion (0.0 to 1.0) of the configured elevation range that is covered by enough observers, useful when you want a single “how well covered” number per ground position. It requires an areaOfInterestInput polygon, with areaOfInterestBottomElevation and areaOfInterestTopElevation defining the elevation slab to evaluate. Combine it with the inherited 3D mesh output for GlobeView display and the volume-encoding raster for VerticalProfileOperator or IsolineOperator, and one chain gives you the same coverage data in three presentation modes.
This is a useful tool when, for instance, designing a radar network, or when you need to find the gaps in a multi-sensor coverage plan.
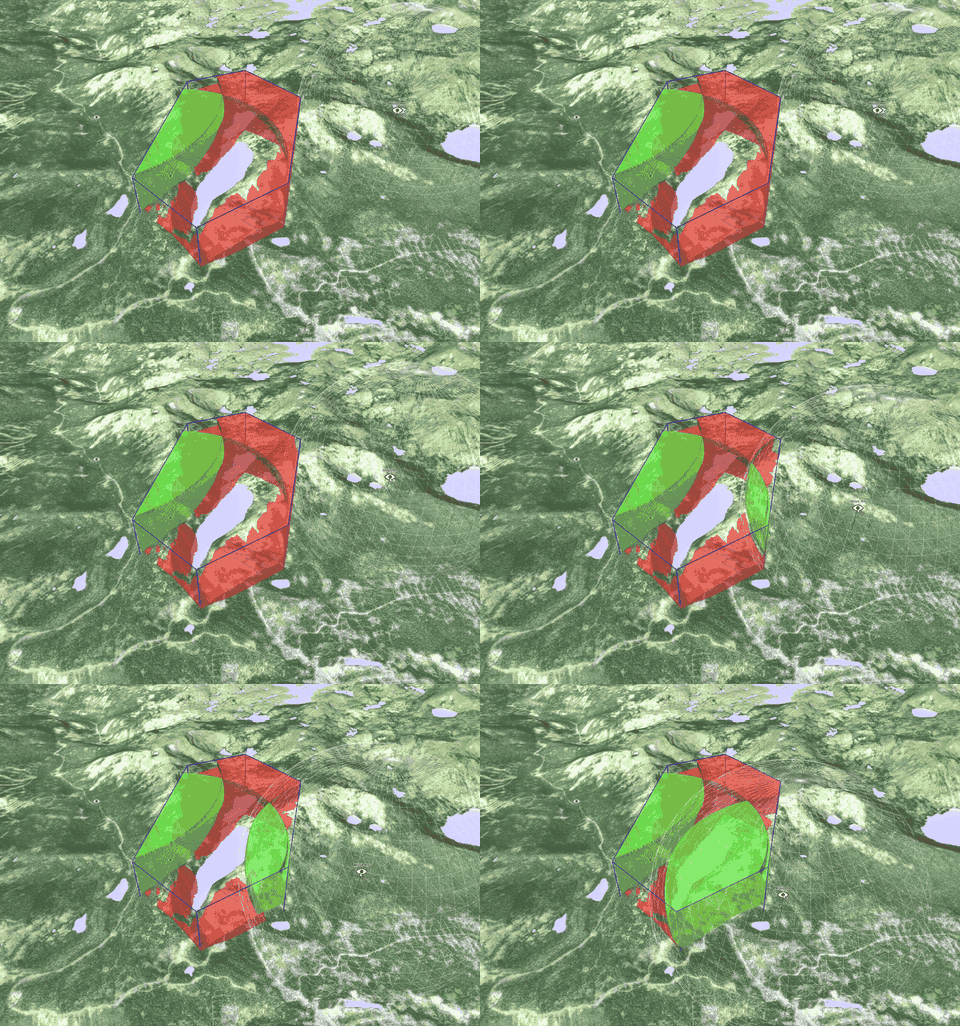
The airspace_coverage.px sample contains a 3D GlobeView showing two observers’ merged airspace coverage inside a blue wireframe area of interest — red marks the airspace not seen by any observer, green marks the dual-coverage region seen by at least two.
In addition to the analysis the LineOfSightOperator performs on elevation raster data, a GlobeView can run its own line-of-sight analysis directly on the 3D ground meshes loaded into the view. That includes any auxiliary meshes, for example from a 3D city model with detailed buildings.
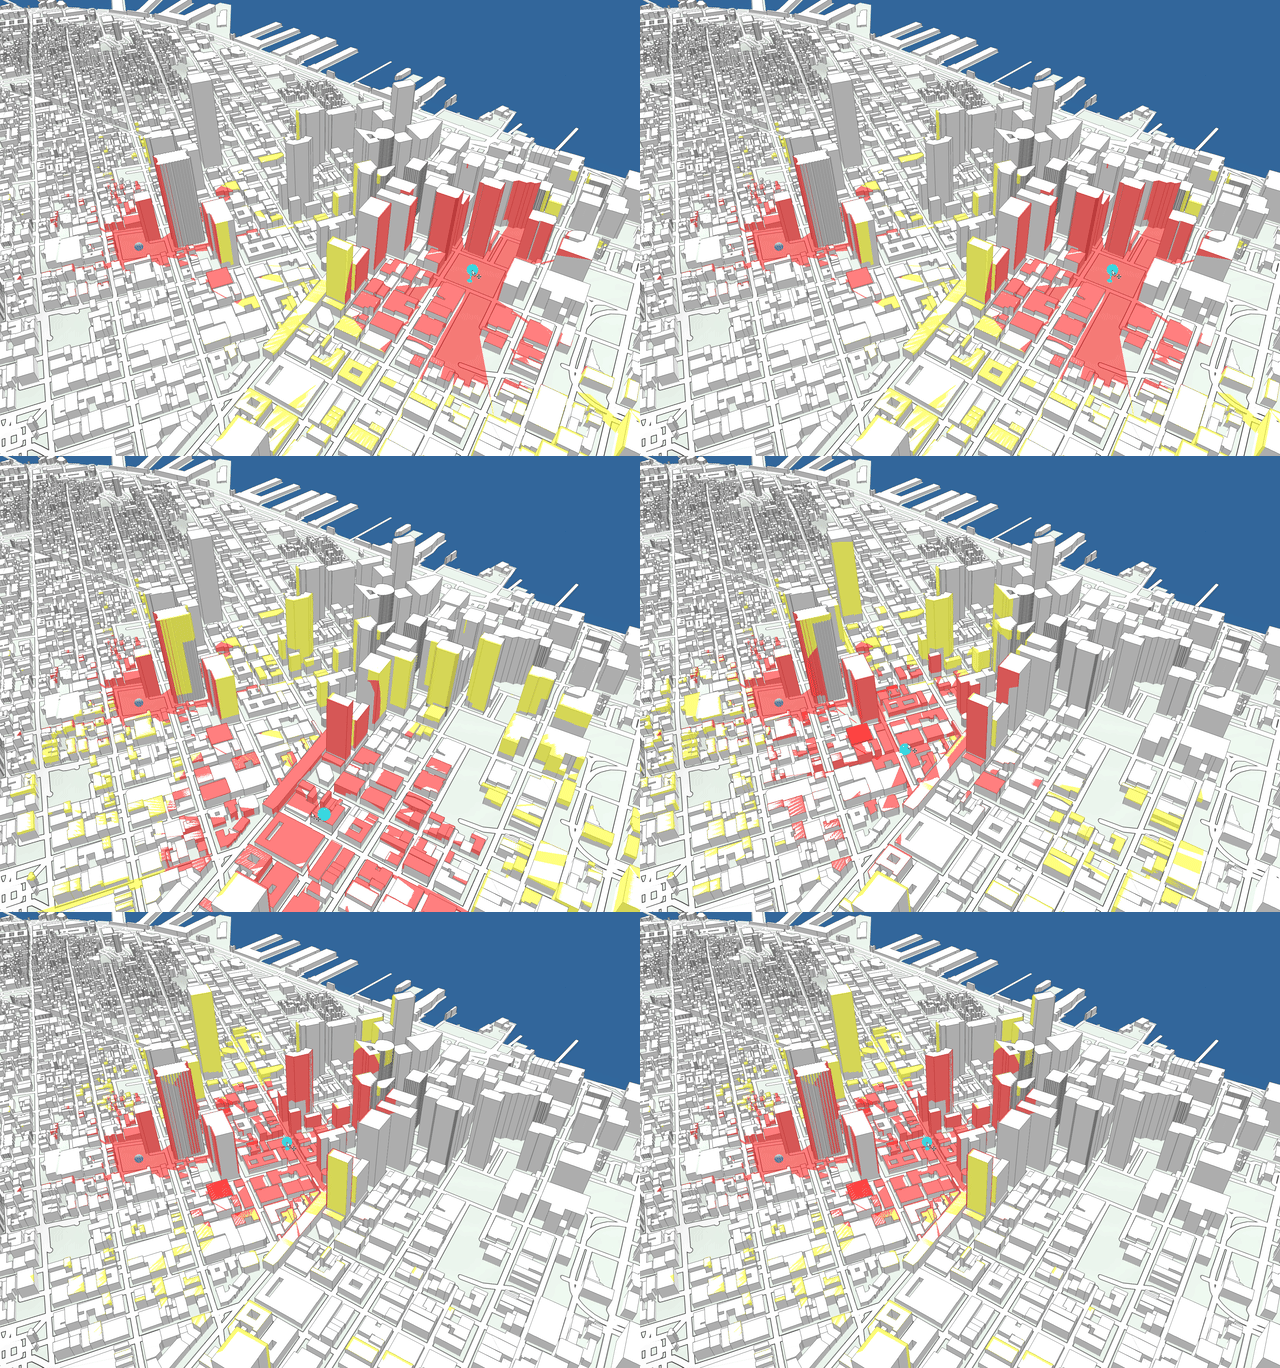
The mechanism is LineOfSightOverlay. It’s not an operator: it’s a class instance you attach to the lineOfSightOverlay property of the GlobeView. The analysis runs on the GPU each frame and the result is painted as a colored overlay on the existing meshes. Up to 10 observers can run simultaneously, read as point features from an Input operator, each with two range bands in different colors and an optional limited field of view.
Pick the overlay when your scene is a 3D model, and you want immediate visual feedback on it. Pick the operators when you need data outputs you can chain into another analysis, cache, or render in 2D or 3D as you wish.
The 3d_line_of_sight.px sample builds a 3D model of San Francisco from OpenStreetMap building polygons and shows two interactive observers with distance-coded coverage.
Five tools, one decision. This table summarizes when to reach for each one.
| Operator | Question | Input | Output | Best for |
LineOfSightOperator |
What can I see? | Observer (point or line), elevation | 2D viewsheds or volume viewsheds. | Single-observer terrain analysis |
TargetLineOfSightOperator |
Which targets can I see? | Observers, targets, elevation | Target features with visibility metadata | Known-asset coverage checks |
VisibilityIndexOperator |
Where should I put the observer? | Observer area, target area, elevation | Per-cell visibility percentage raster | Observer placement and siting |
AirspaceCoverageOperator |
What can we see together? | Multiple observers, elevation | Merged 2D viewsheds or merged volume viewsheds, or a 2D coverage raster. | Sensor network design |
LineOfSightOverlay |
What is visible in this 3D model? | Point observers, 3D meshes in a GlobeView |
Real-time 3D surface highlights | City models with buildings and overhangs |
One more for completeness: for solar illumination analysis, Carmenta Engine also has the ShadowOperator. It outputs shadow-height rasters from elevation data, with the sun position taken from View.sunPosition. Use it when you care about sunlit-versus-shadowed terrain rather than observer-driven visibility.
This article gave you the surface. The depth lives in three places.
For a hands-on walkthrough of binding LineOfSightOperator properties to dynamic application data, see the existing article Dynamic Visibility Analyses.
For the full property reference and sample configurations, see the Visibility Analysis chapter in the Carmenta Engine SDK documentation.
Learn how to use land classification in Carmenta Engine to visualize terrain and validate feature placement from C# with a tactical symbols sample.
View Post