Next Post
Nautical Charts Setting Up S-63
Learn how to set up S-63 encrypted nautical charts in Carmenta Engine. Step-by-step guide covering user permits, database creation, and visualization.
View PostIn this article you will learn some ways to interact with nautical charts in Carmenta Engine. While the SDK sample S57_S52_nautical_chart.px shows how to visualize Nautical Charts using an S52Visualizer and S57DataSet, this article focuses on chart interactions through the following examples:
Features in a dataset can be queried based on their attributes. For a S57DataSet, a typical use-case is when your application needs to detect elements around your ship (beacons, restricted areas, coastline…).
The S57 Standard – Appendix A describes how to identify an object on the chart through its Code. Browsing through the Code or Object lists provides the necessary information to build the query. For example, Code 112 refers to the Restricted area object, as shown below:
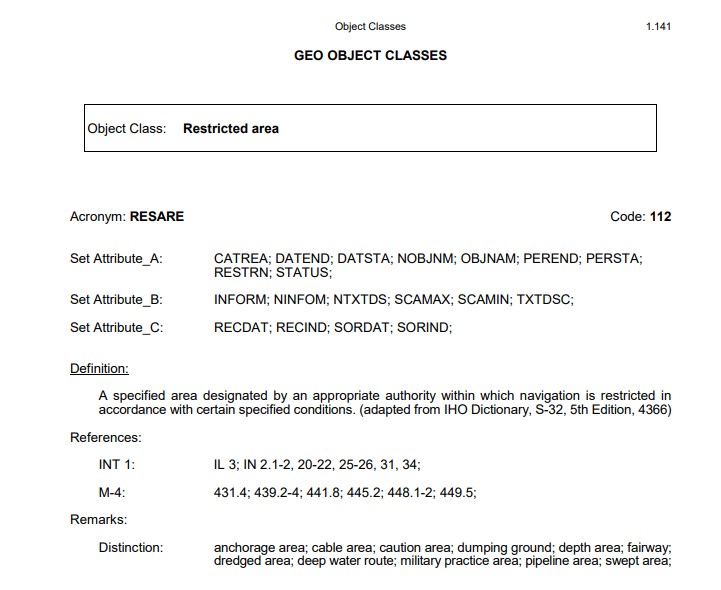
Additionally, this includes:
In Carmenta Engine, the attribute Code is called OBJL. To get all Restricted area features, build a query like this:
// Create the feature query with condition on OBJL
FeatureQuery featureQuery = new FeatureQuery();
featureQuery.Condition = new Condition("OBJL in (112)") // 112 = Restricted area

// Retrieve ALL features matching the Condition
List<Feature> features = _s57DataSet.GetFeatures(featureQuery).ToList();
As mentioned, the query above will return ALL features matching the condition. Depending on the dataset size, this can take a while and return many features that might not be relevant because they don’t match your area of interest or other criteria. You can improve the query like this:
double radius = 1000; // radius (in meters); can be a setting or from elsewhere in the application
// Process an area of interest around shipLocation, in this case a full circle of radius 1km
MemoryDataSet radiusDataSet = new MemoryDataSet(Crs.Wgs84LongLat);
radiusDataSet.Insert(new Feature(new PointGeometry(new Point(shipLocation.X, shipLocation.Y)), Crs.Wgs84LongLat));
EllipseOperator ellipseOperator = new EllipseOperator(new ReadOperator(radiusDataSet))
{
    Radius = radius
};

feature = ellipseOperator.GetFeatures(Crs.Wgs84LongLat).FirstOrDefault();

// Create the feature query with condition on OBJL
FeatureQuery featureQuery = new FeatureQuery();
featureQuery.Condition = new Condition("OBJL in (112)") // 112 = Restricted area
featureQuery.Area = feature.CalculateBounds();

// Retrieve features matching the Condition
List<Feature> features = _s57DataSet.GetFeatures(featureQuery).ToList();
Now you have the features close to your shipLocation. You can further optimize by filtering on GeometryType to retrieve only features of a specific geometry:
...
// Retrieve features matching the Condition AND of Polygon type
List<Feature> features = _s57DataSet.GetFeatures(featureQuery).Where(f => f.GeometryType == GeometryType.Polygon).ToList();
Note that the condition can include multiple Codes or test other attributes. Your application needs to build and provide the condition. For example:
...
// 92 = Pipeline area
// 112 = Restricted area
// 154 = Unsurveyed area
featureQuery.Condition = new Condition("OBJL in (92, 112, 154)")
...
More information about Expression Syntax and how to build them.
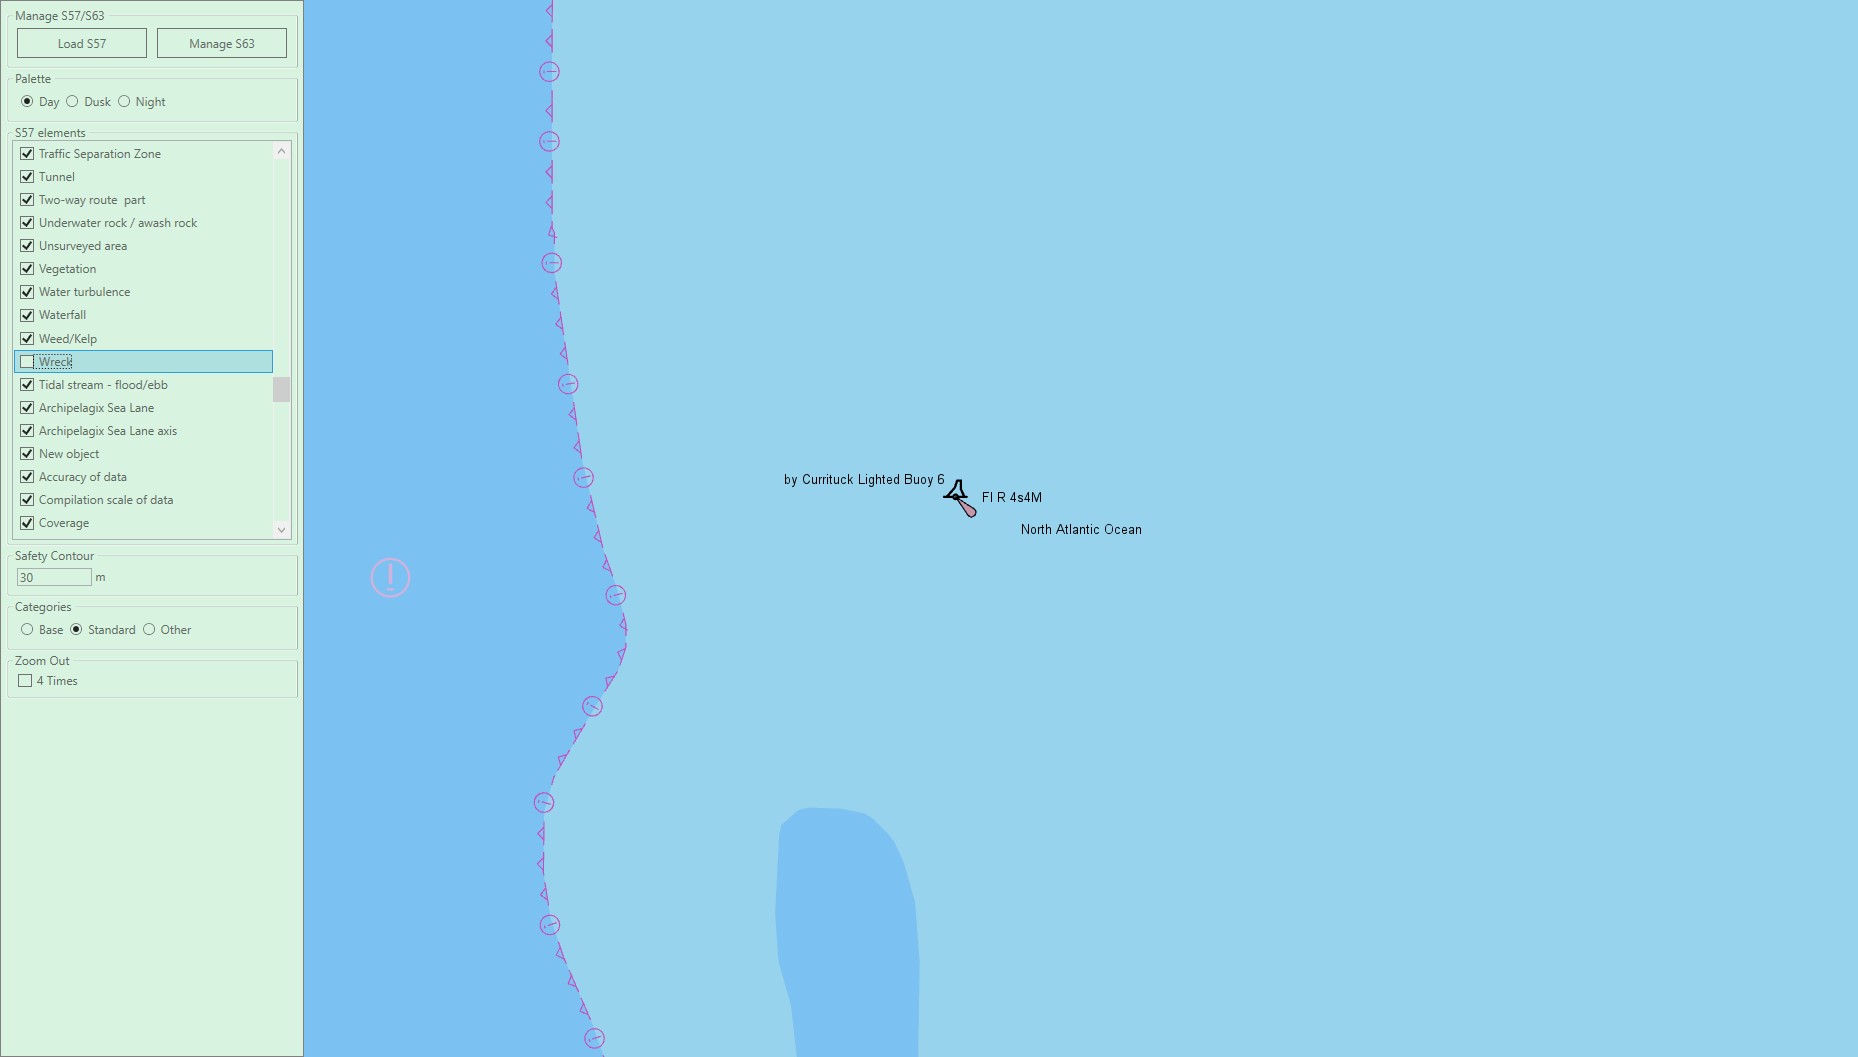
This section demonstrates how to interact with nautical charts through the S52Visualizer. You can filter using the Visualizer.Condition property to control which content is visualized on the charts.
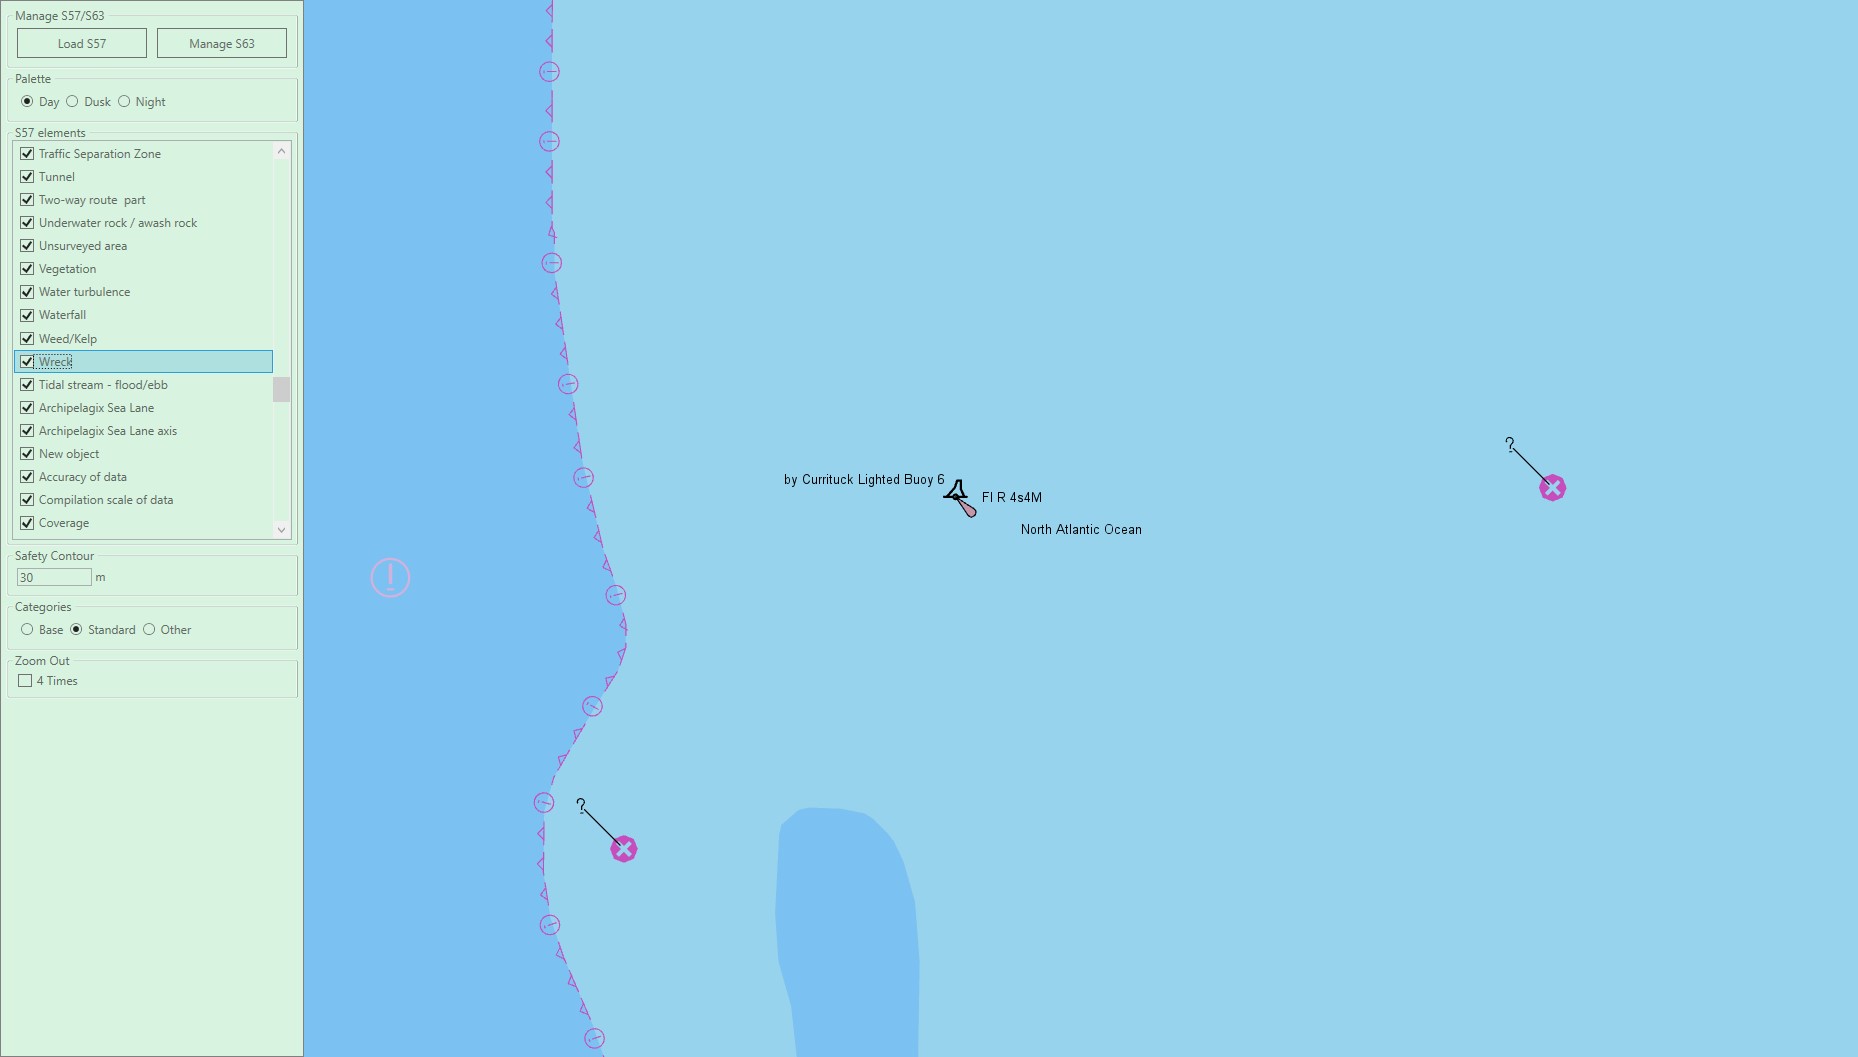
As before, build the condition based on the OBJL attribute. For example, consider Wreck or Obstructions objects (Code:159), which are represented in the screenshot below by the purple symbol with a ‘?’.
// _s52Visualizer and _view are instanciated from the configuration file
using (new Guard())
{
    _s52Visualizer.Condition = new Carmenta.Engine.Condition("OBJL in (159)");
}

_view.FlushLayersContainingObject(_s52Visualizer);
_view.Update();
Since the visualizer is part of the View, we need to take the Guard to prevent Carmenta from throwing an exception. Applying this condition produces the following result:
To reset the condition on the visualizer, create a condition with true. This will re-enable all features.
// _s52Visualizer and _view are instanciated from the configuration file
using (new Guard())
{
    _s52Visualizer.Condition = new Carmenta.Engine.Condition("true");
}

_view.FlushLayersContainingObject(_s52Visualizer);
_view.Update();
This section covers some properties available on the S52Visualizer and how to interact with them in code.
The S52Visualizer supports three different palettes for different light conditions: a day palette with bright colors, a dusk palette with darker colors, and a night palette with very dark colors. You can change the S52Palette value directly on the visualizer:
using (new Guard())
{
    if (radioButton.Name == S52Palette.Day.ToString()) _s52Visualizer.Palette = S52Palette.Day;
    if (radioButton.Name == S52Palette.Dusk.ToString()) _s52Visualizer.Palette = S52Palette.Dusk;
    if (radioButton.Name == S52Palette.Night.ToString()) _s52Visualizer.Palette = S52Palette.Night;
}

_view.FlushLayersContainingObject(_s52Visualizer);
_view.Update();
The code above is extracted from OnPaletteChanged in the NauticalChartsDemo. In this demo, the radioButton is a UI component named to match the S52Palette enumeration, which applies the correct color scheme to _s52Visualizer.Palette. Updating the palette produces the following results:
| Palette | Result |
| Day | 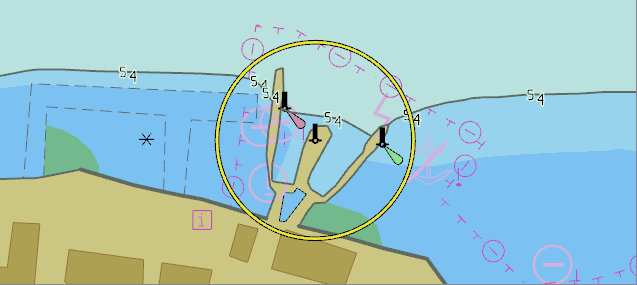 |
| Dusk | 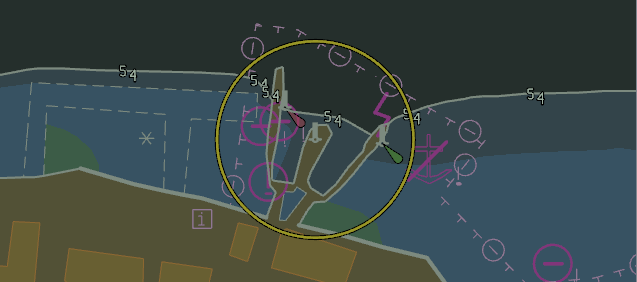 |
| Night | 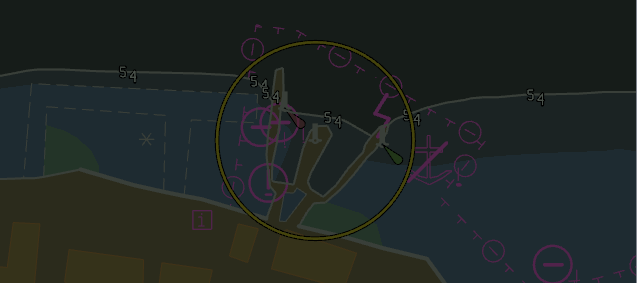 |
Note: the colors are defined by the S57 standard.
Another relevant property is the safety contour. It affects the coloring of depth areas and where they are drawn in the chart. Updating this property is useful for applications where ships have limitations and can’t navigate in shallow water. To update the SafetyContour, use the following code extracted from NauticalChartsDemo:
using (new Guard())
{
    _s52Visualizer.SafetyContour = newSafetyContour;
}

_view.FlushLayersContainingObject(_s52Visualizer);
_view.Update();
Below are some results:
| Safety Contour | Result |
| 30m | 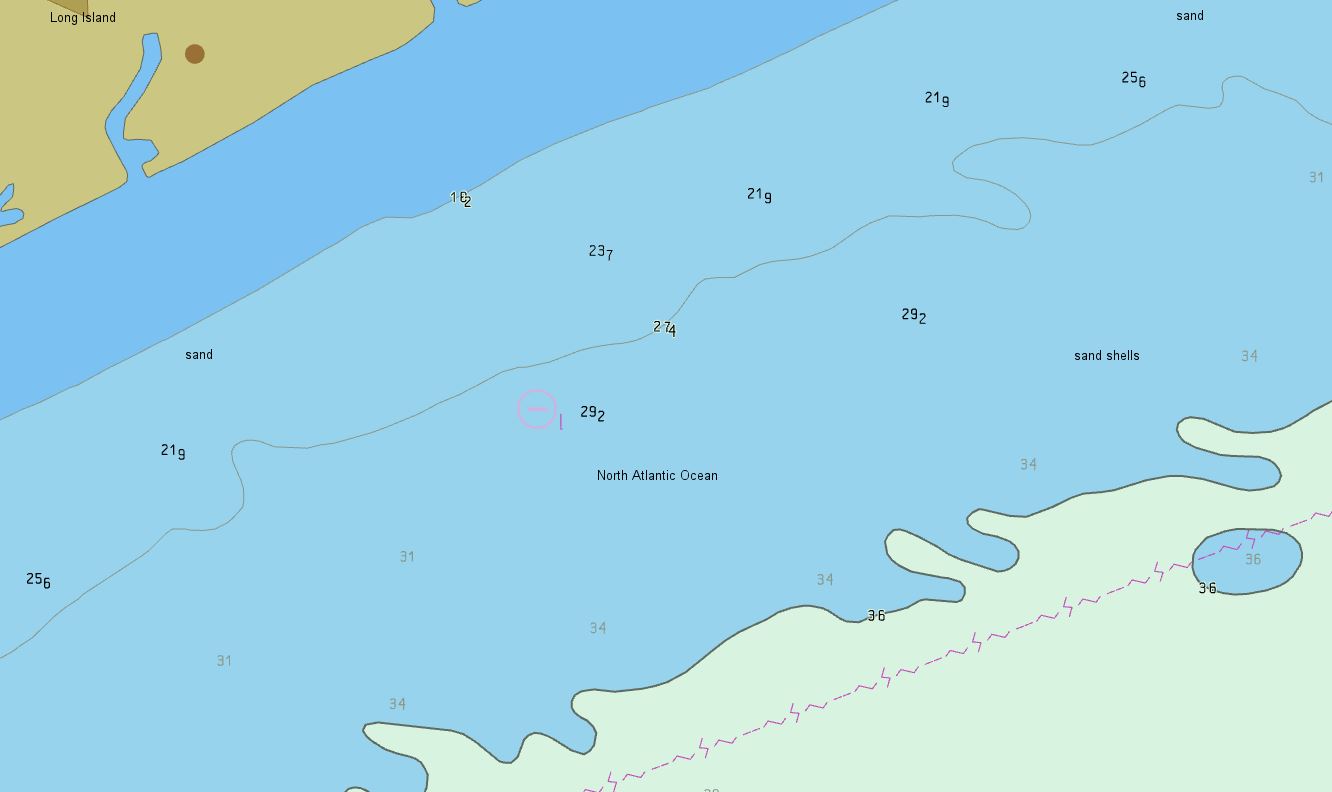 |
| 20m | 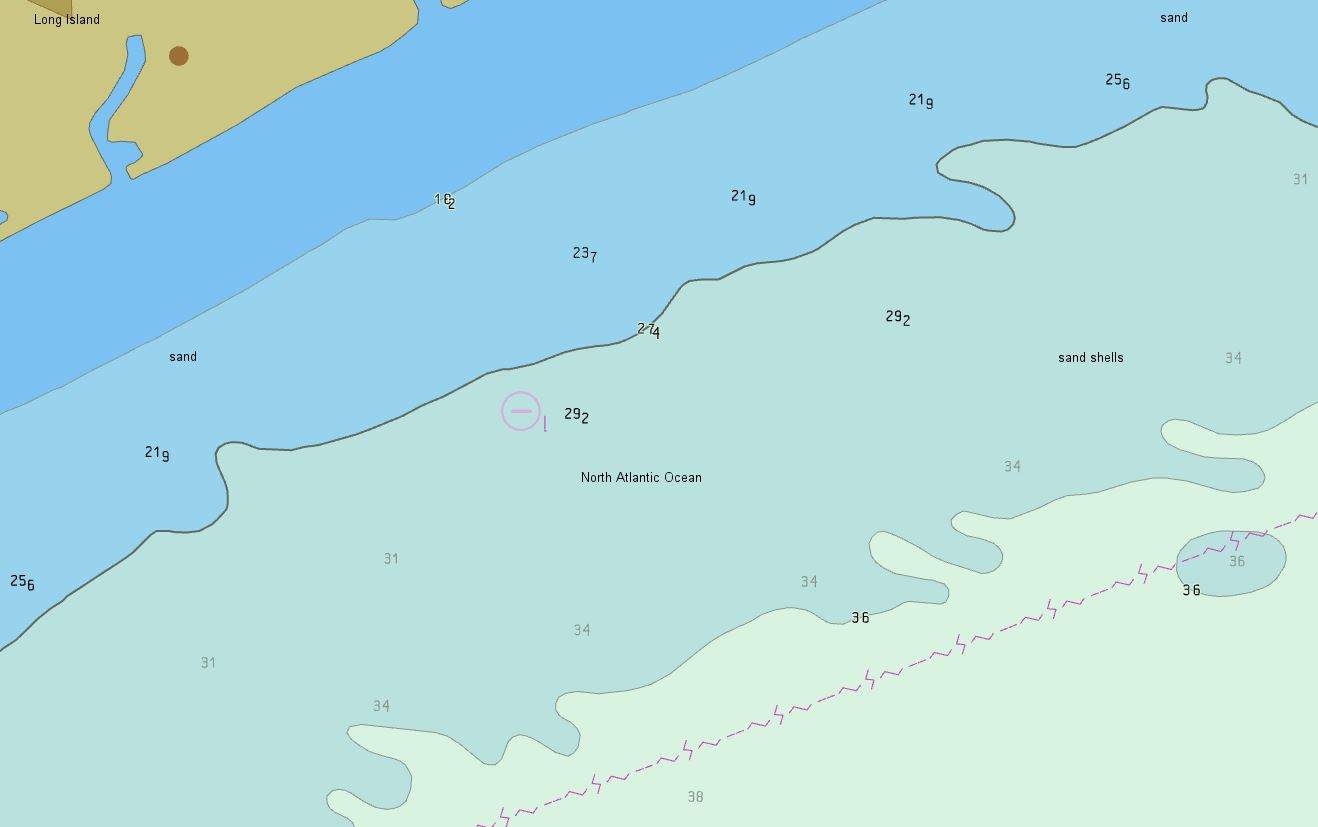 |
| 10m | 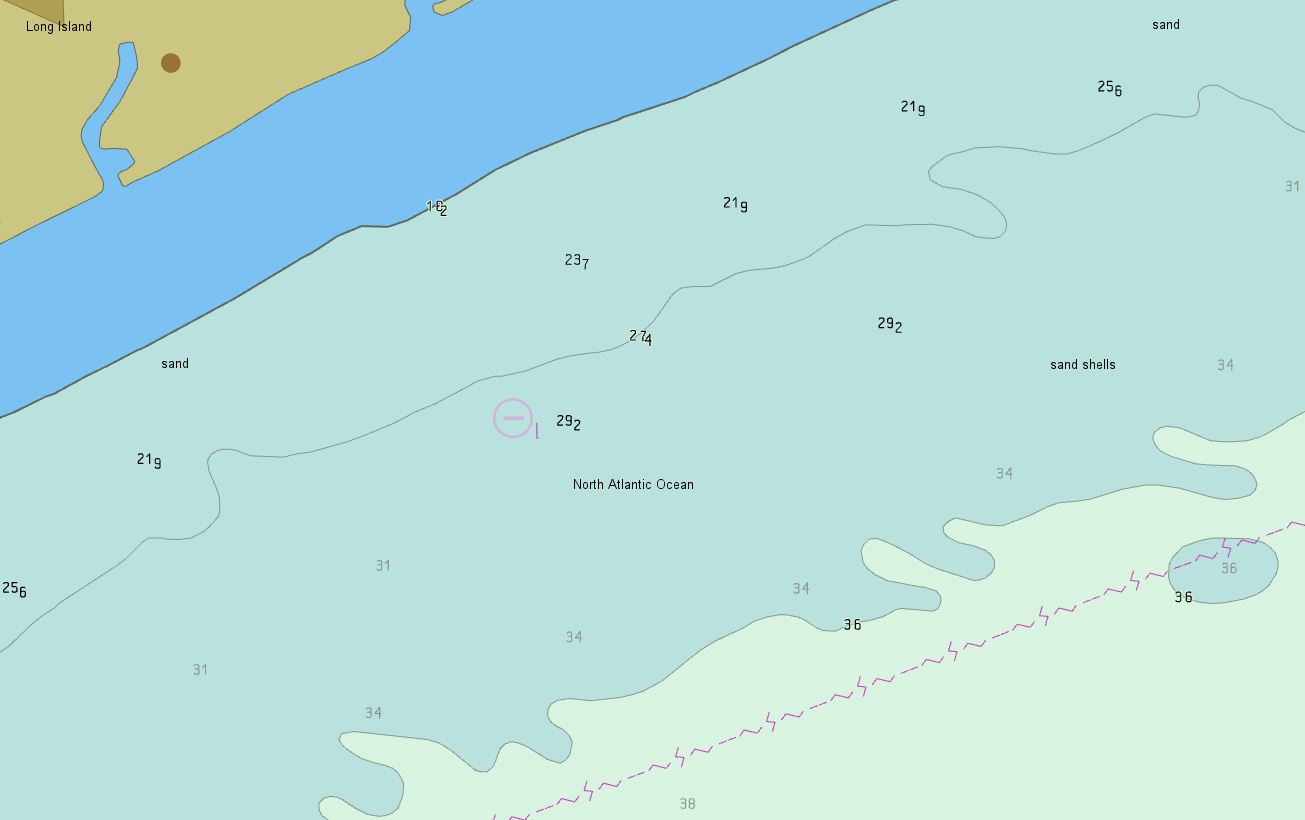 |
The S52DisplayCategory property specifies the amount of information shown in the chart. This is useful for hiding unnecessary objects on some charts. Below is the code used in NauticalChartsDemo to update the display category:
using (new Guard())
{
    if (radioButton.Name == S52DisplayCategory.Standard.ToString())
        _s52Visualizer.DisplayCategory = S52DisplayCategory.Standard;

    if (radioButton.Name == S52DisplayCategory.Base.ToString())
        _s52Visualizer.DisplayCategory = S52DisplayCategory.Base;

    if (radioButton.Name == S52DisplayCategory.Other.ToString())
        _s52Visualizer.DisplayCategory = S52DisplayCategory.Other;
}

_view.FlushLayersContainingObject(_s52Visualizer);
_view.Update();
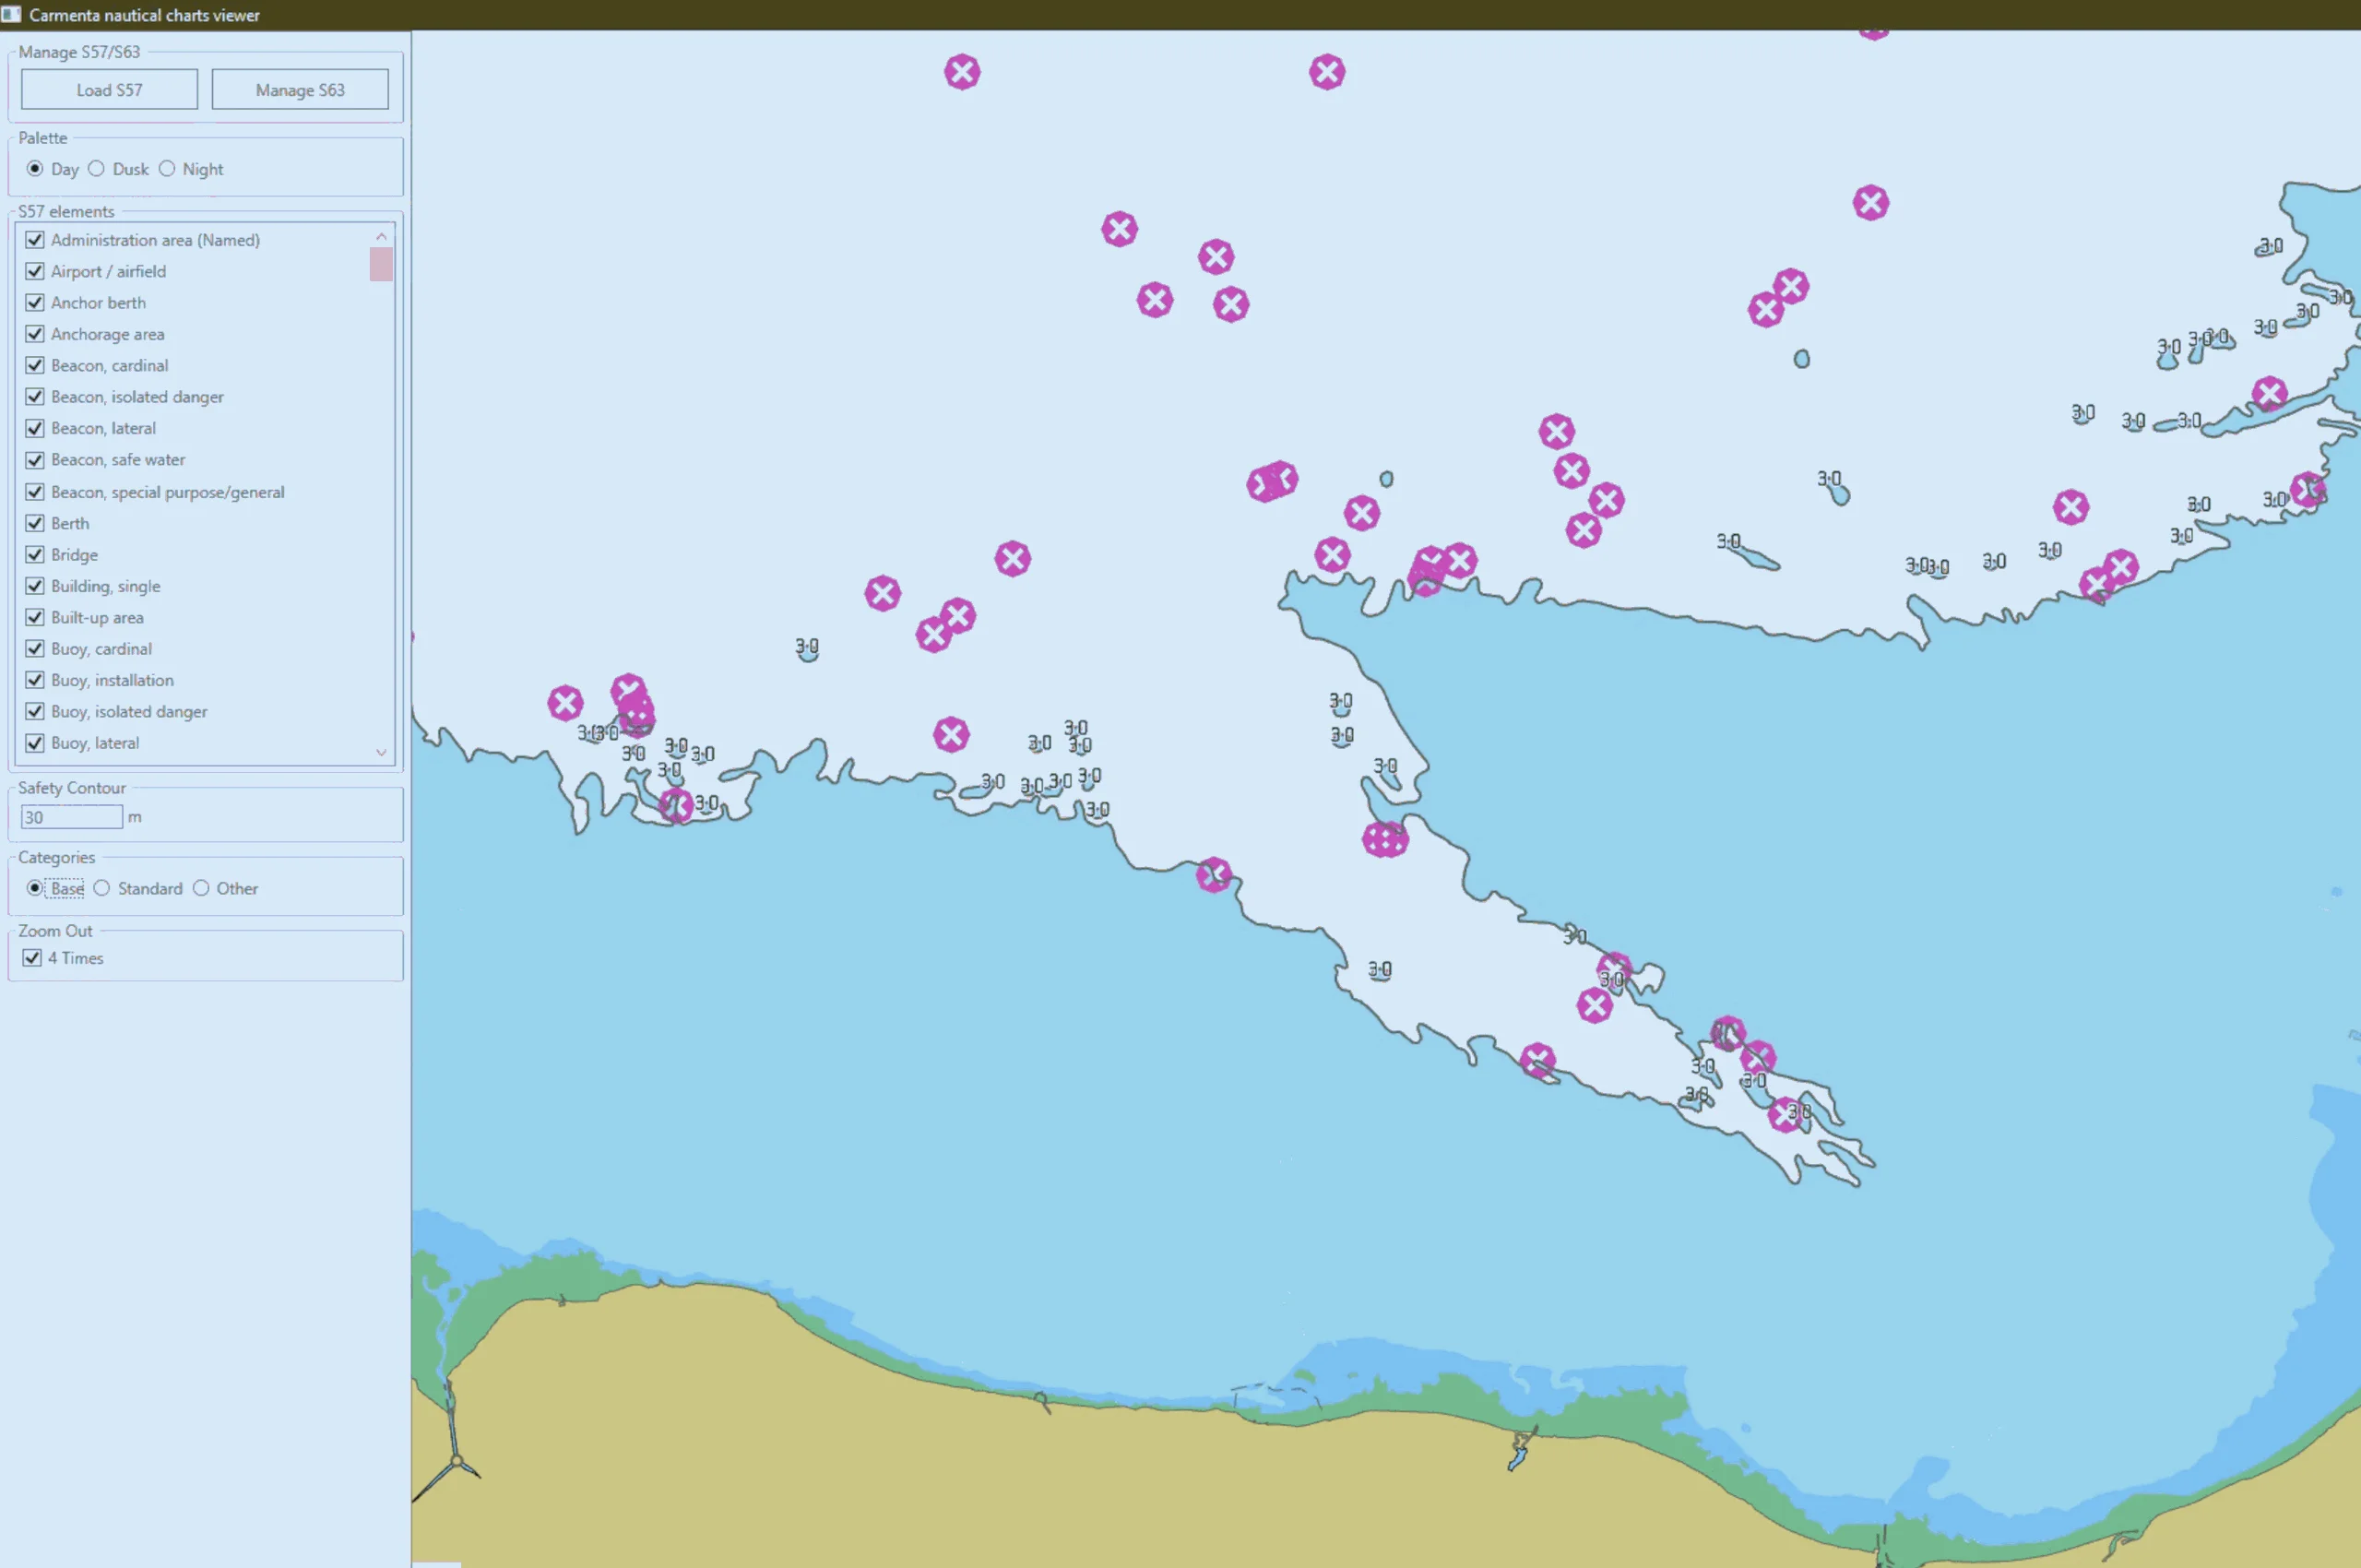
As before, we use a radioButton named to match the S52DisplayCategory enumeration to switch between categories. Updating the DisplayCategory produces the following results:
| Display Category | Result |
| Base | 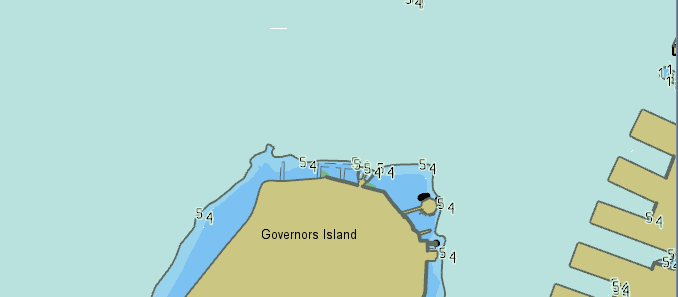 |
| Standard | 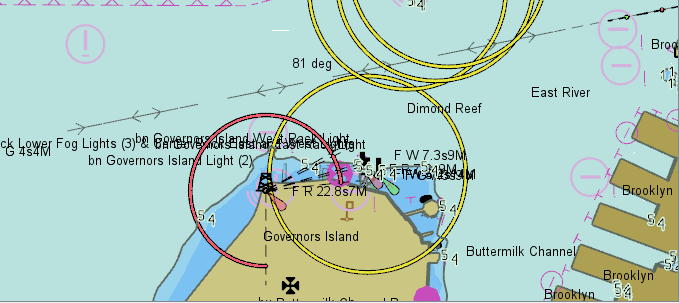 |
| Other | 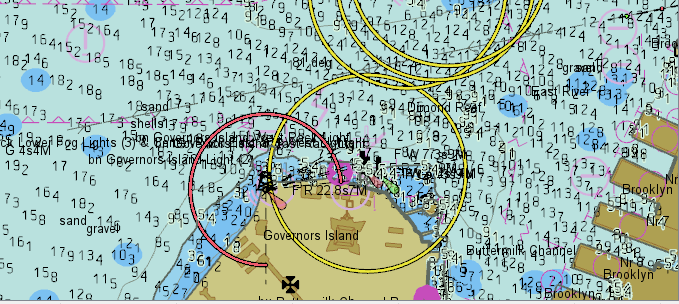 |
An alternative way to update the properties on the visualizer is to use View.UpdateAttributes from the View. Let’s take for example safetyContour:
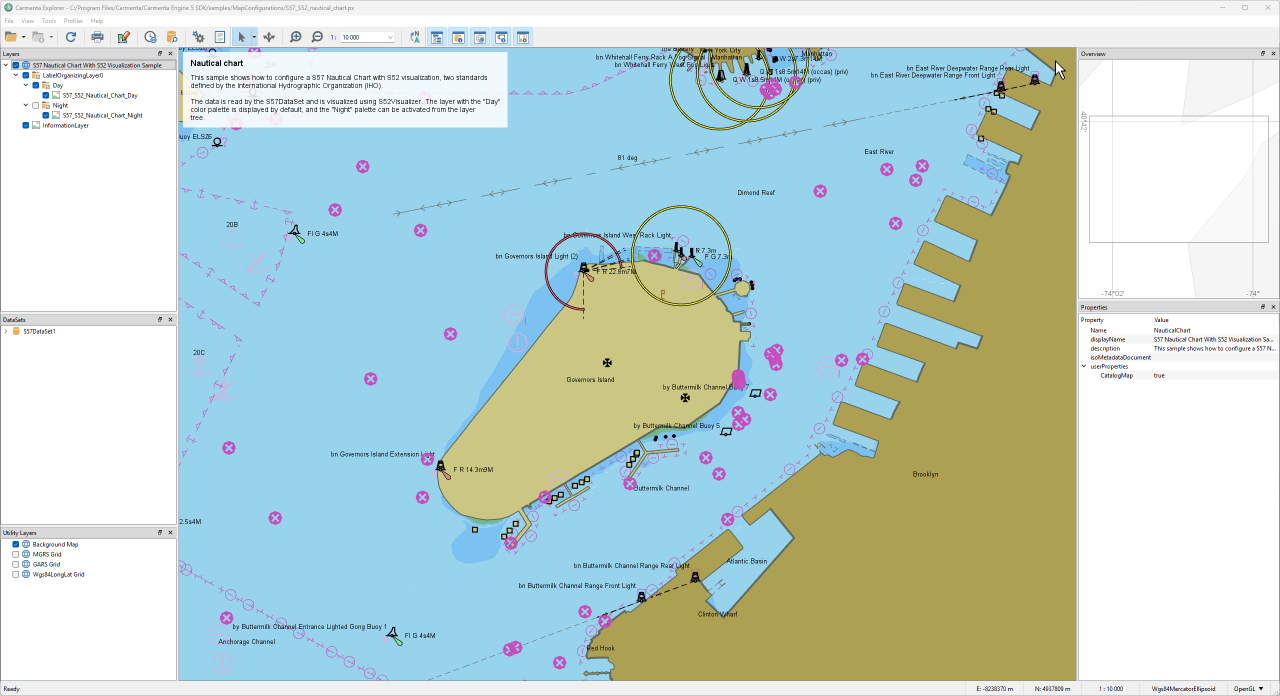
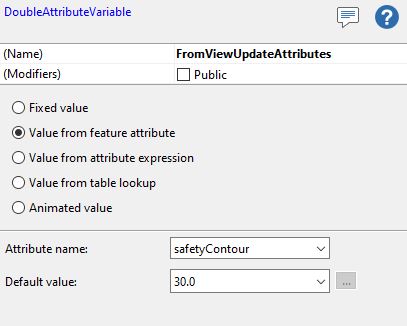
The first step is to configure the attribute on the S52Visualizer. Open the configuration file in Carmenta Studio and navigate to the desired Visualizer. For the property you want to configure, click on the small + icon and select DoubleAttributeVariable. This opens a property panel where you select Value from feature attribute and provide an Attribute name and a Default value:
The second step is to set the attribute on the updateAttributes view property. Inside Carmenta Studio, select your View object. If you don’t have an AttributeSet defined on the View, create one and add your attribute. It should look like this:
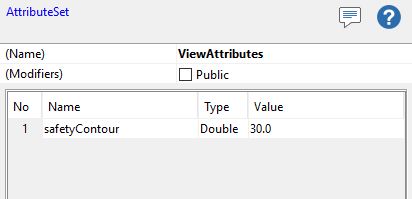
It is important that the name defined on the DoubleAttributeVariable from the Visualizer and the one defined on the AttributeSet are the same. If you save and launch the configuration in Carmenta Explorer, you will see it working. You can now update the code by replacing the following:
using (new Guard())
{
    _s52Visualizer.SafetyContour = newSafetyContour;
}

_view.FlushLayersContainingObject(_s52Visualizer);
_view.Update();
by directly calling the attribute from the view:
using (new Guard())
{
    _view.UpdateAttributes["safetyContour"] = newSafetyContour;
}

_view.FlushCache(); // necessary if the dataset is 'behind' a tilelayer to make sure the cache is up to date
_view.Update();
Note: If the Attribute safetyContour does not exist on the _view.UpdateAttributes, it will be added; otherwise the attribute will be updated. Therefore, the second step is optional and can be used to verify directly in Carmenta Explorer that it works properly.
This article covers S-57 (unencrypted) nautical charts. If you need to work with S-63 encrypted charts, see Nautical Charts Setting Up S-63 to learn how to prepare and load encrypted chart data. The NauticalChartsDemo application supports both S-57 and S-63 charts.
Download the NauticalChartsDemo application used in this article: NauticalChartsDemo.zip
Learn how to set up S-63 encrypted nautical charts in Carmenta Engine. Step-by-step guide covering user permits, database creation, and visualization.
View Post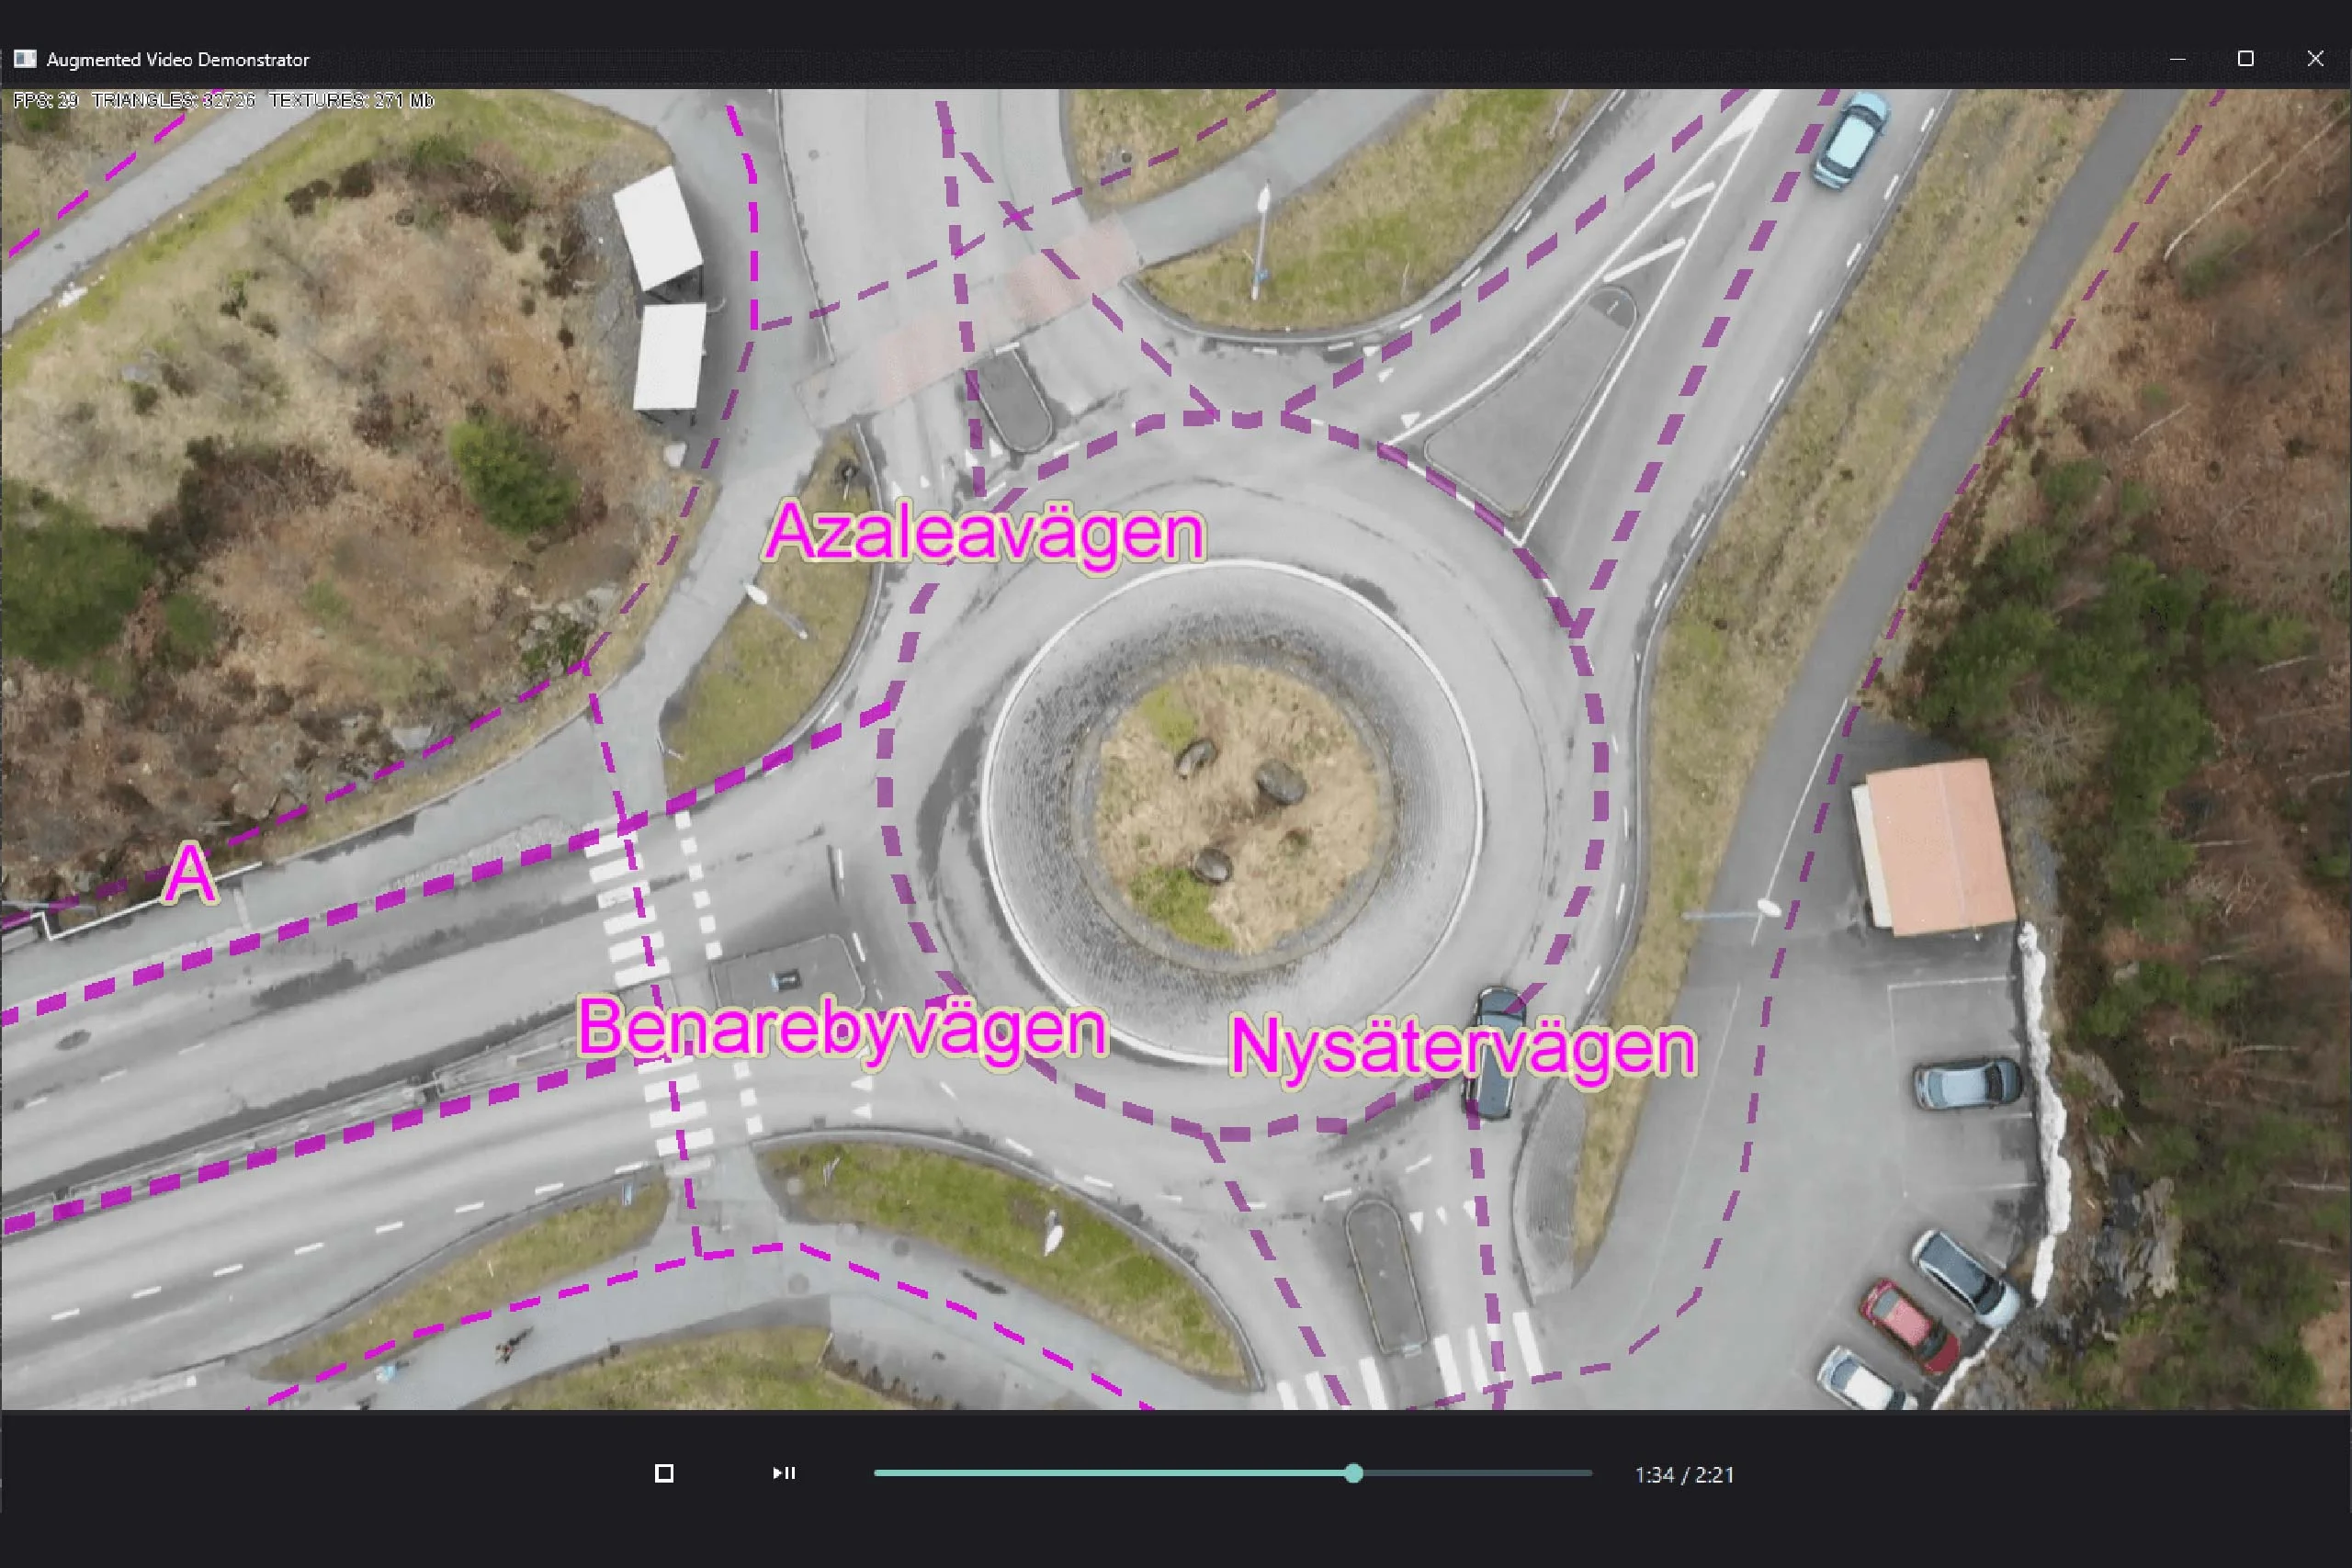
Explore how augmented video applications allow developers to overlay geospatial information on video feeds, enhancing the user's understanding of the environment.
View Post